


Bitcoin’s recent rally has improved the overall sentiment among market participants. This change of scene has spurred a positive momentum across the industry as signs of a bull market start popping.
Technical Analysis
By Shayan
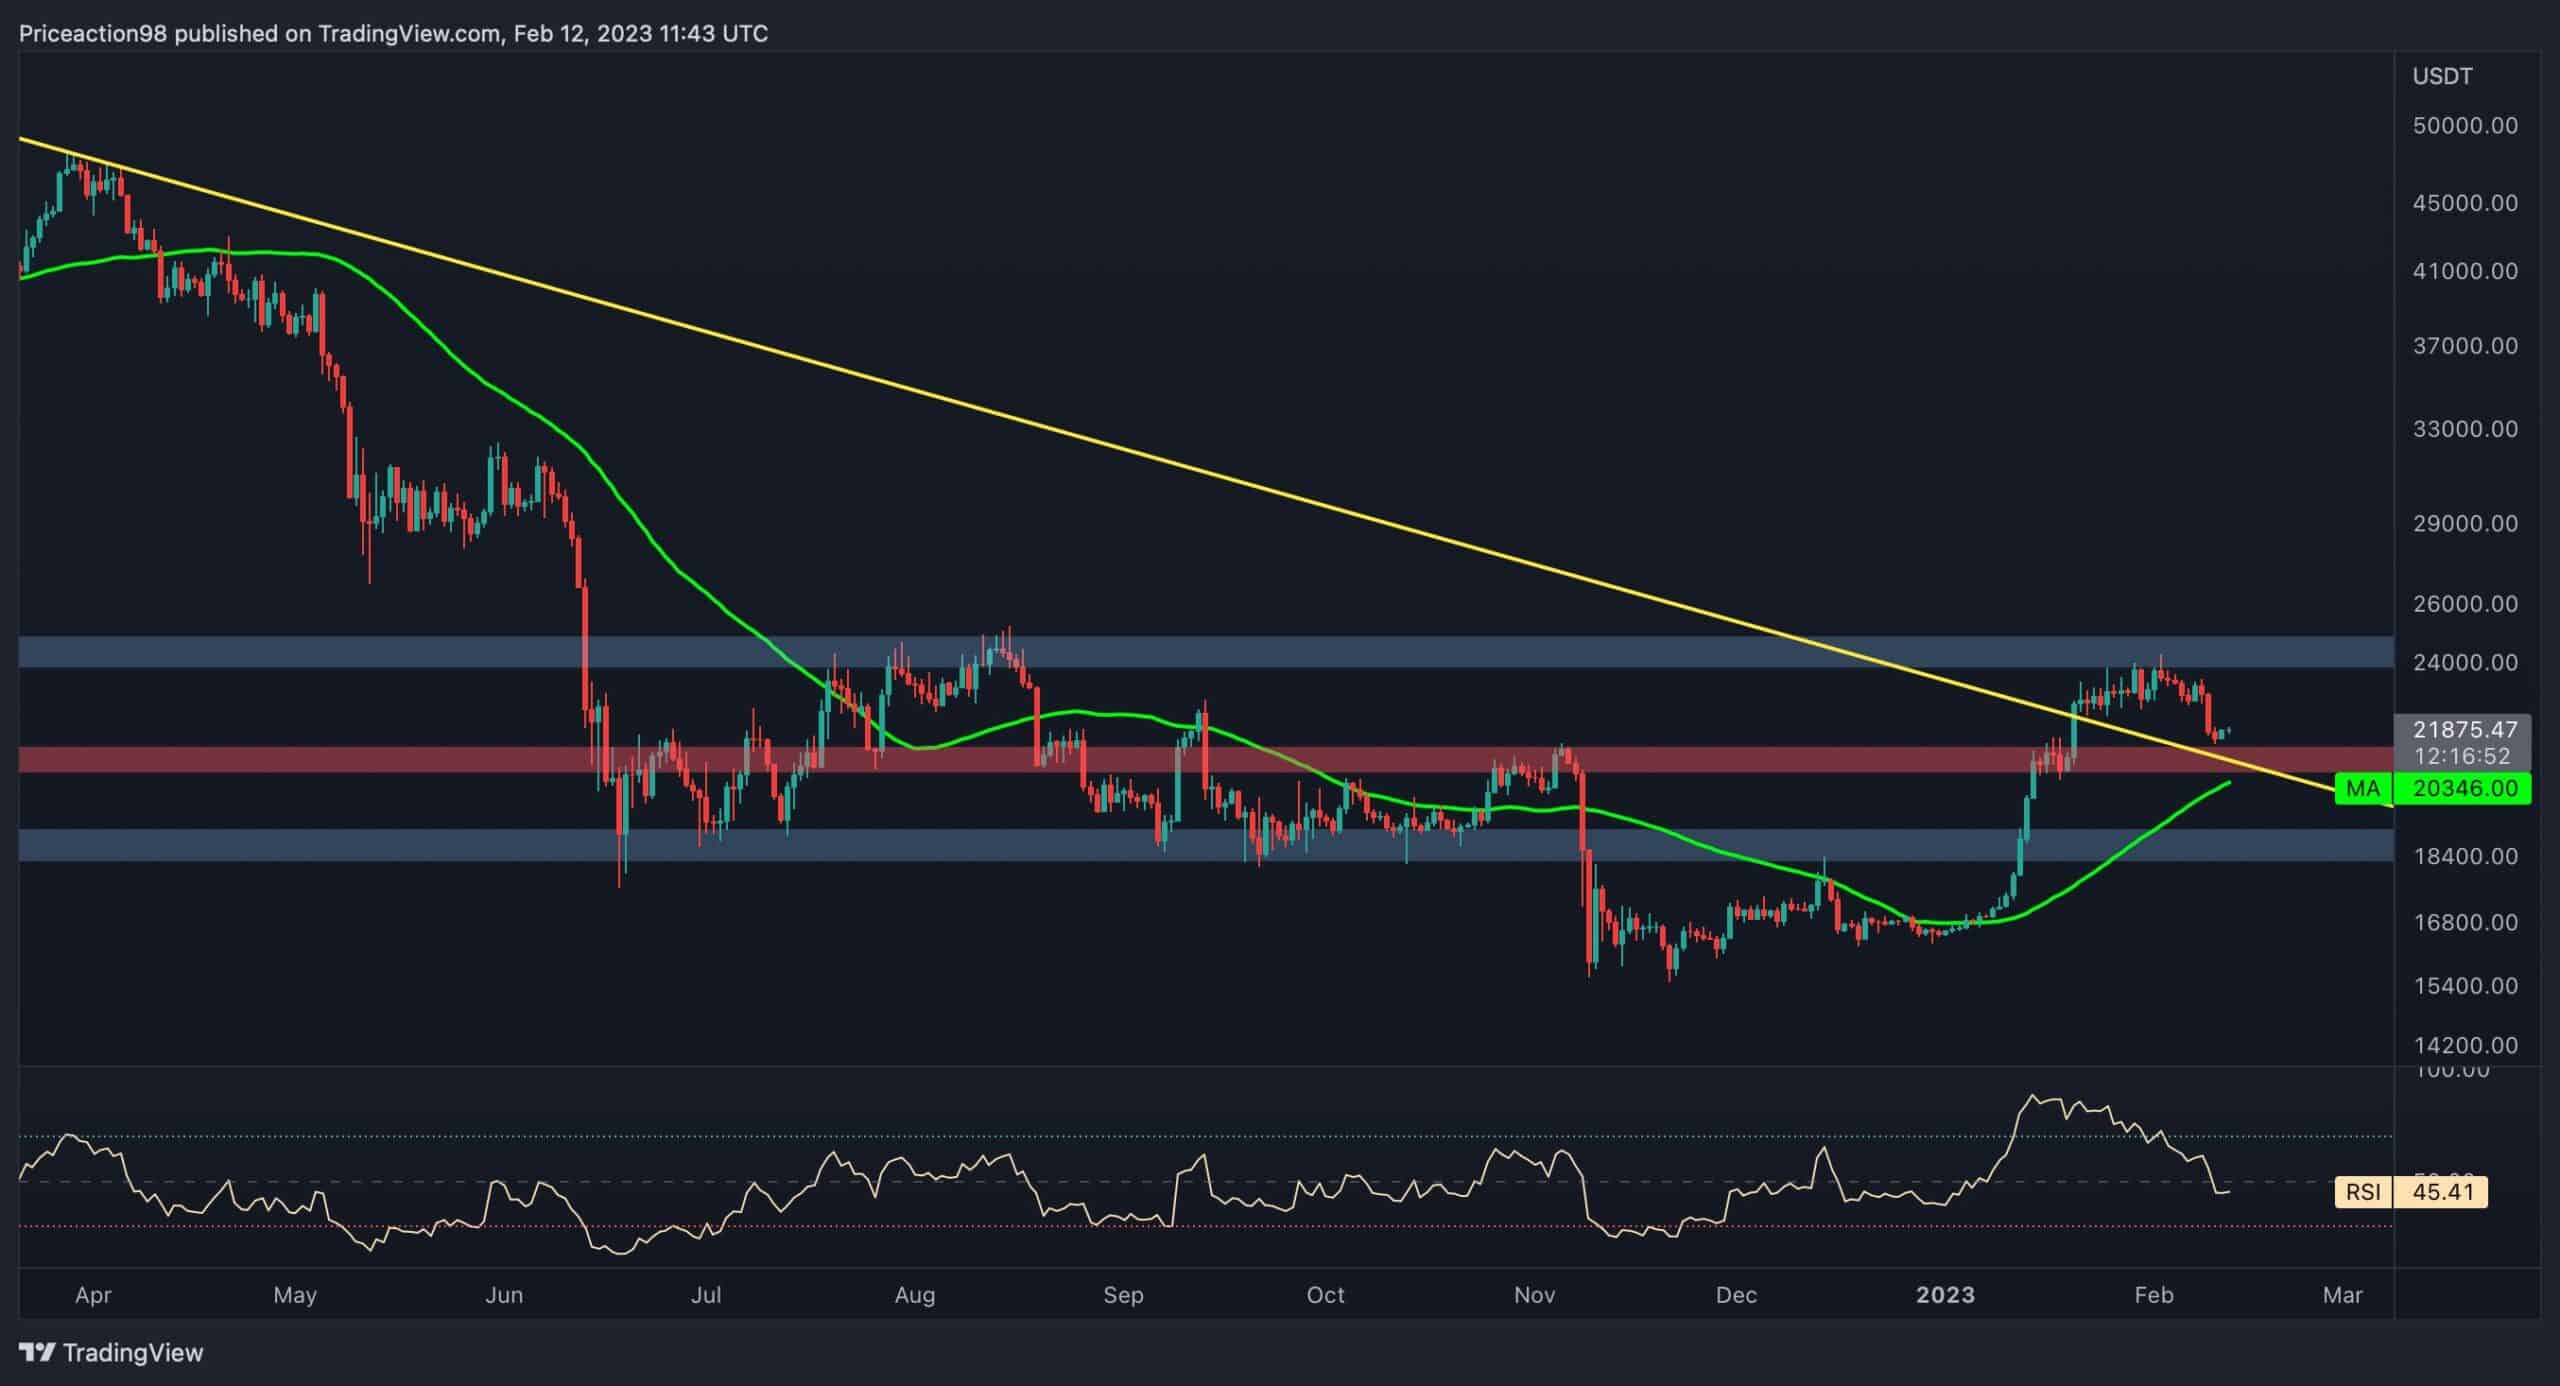
The Daily Chart
The $25K price region has been the most significant barrier in Bitcoin’s path during the last eight months. Most recently, the price attempted to surpass this level and failed, resulting in a consolidation correction stage.
However, after an impulsive surge, a correction phase is essential for the continuation of the rally, which usually is simultaneous with the formation of the pullbacks.
Hence, the recent plummet can be considered a correction phase to form a pullback to the broken descending trendline, flushing out over-heated futures market positions and initiating another spike.
Nevertheless, the $21K price level and the 50-day moving average, currently at $20.3K, are the primary support levels and could act as the next target for the recent decline.
Source: TradingView
The 4-Hour Chart
On the 4-hour timeframe, the price began a slight bearish leg after being rejected from the $25K substantial resistance region and grabbed sell-stop orders below the $22.3K minor support level.
Typically, the price tends to grab sell-stop orders below support levels during the correction stages of a bullish rally before continuing to surge.
Furthermore, following the recent plummet, the price has reached a significant support region, consisting of the $21K support level and Fibonacci’s decisive levels between 0.382($21,604) and 0.5($20,785).
As a result, BTC faces substantial support and seems likely to start another bullish leg in the upcoming days.
Source: TradingView
On-chain Analysis
By Edris
Bitcoin’s recent price rally has made many investors believe that the bear market is finally over. Holders who have been underwater for the last few months are back in profit again. However, there are still some caution signs, as this increase could be another bull trap during the bear market.
This chart demonstrates the short-term holders’ SOPR metric, which measures the ratio of profits realized by the market participants who have bought their coins in the last six months. Values below one indicate losses, and values above one are associated with profits being realized.
Following the rally over the last couple of weeks, the short-term holders who have accumulated BTC at lower average prices realized their profits.
Although profit taking is not necessarily a negative sign, but this metric has reached values previously seen at the $69K all-time high. If this selling pressure does not meet demand, the correction might continue.
Source: CryptoQuant
The post Bitcoin Dipped Below $22K But Bulls Might Be Preparing Another Push Higher (BTC Price Analysis) appeared first on CryptoPotato.