


Ethereum’s price has finally broken above a key resistance level and continues to rally higher. However, the RSI is presently demonstrating some warning signals.
Technical Analysis
By: Edris
The Daily Chart
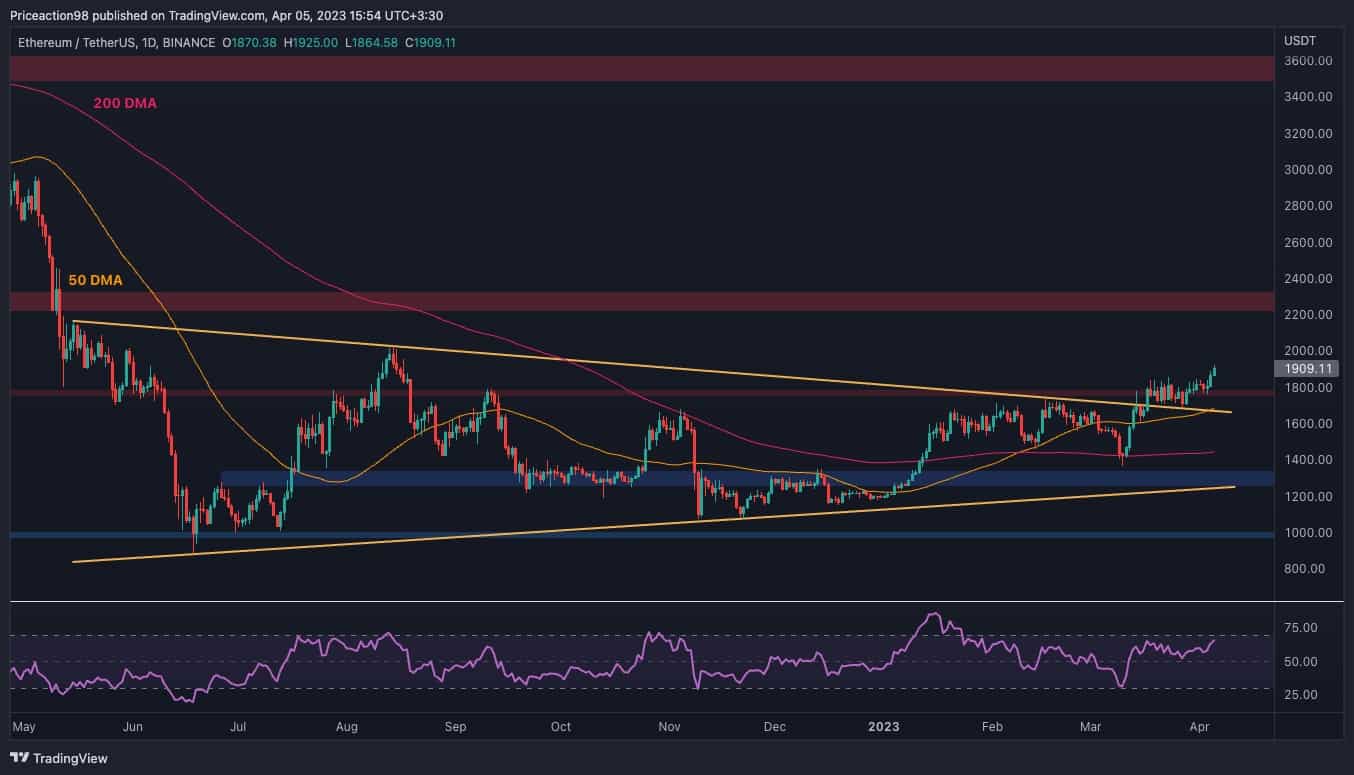
On the daily chart, the price is finally clearing the broken $1800 resistance level, following multiple retests. The higher boundary of the large symmetrical triangle has also provided support for the price, pushing it back higher above the $1800 level earlier last week.
Currently, the price could rise toward the $2300 level from a classical price action standpoint. However, the RSI indicator should be monitored closely as it is approaching the overbought zone, which could lead to a correction or reversal.
In the event of a decline, the $1800 level could once again be considered a probable support zone to hold the market.
Source: TradingView
The 4-Hour Chart
On the 4-hour timeframe, it’s apparent that the price has finally broken out of the tight consolidation zone between the higher boundary of the symmetrical triangle and the $1850 resistance level.
While this is considered a bullish signal as the price is making a new higher high, the RSI is signaling a clear overbought state on this timeframe, which could lead to a pullback or even a reversal in the short term.
Therefore, the $1850 level, followed by the $1800 area and the higher trendline of the triangle pattern, could be the potential targets in the short term if the market corrects.
Source: TradingView
Sentiment Analysis
Ethereum Taker Buy Sell Ratio (SMA 100)
Ethereum’s price keeps making higher highs and lows, continuing the recent bullish trend. Yet, the futures market is demonstrating a worrying signal that a correction or reversal is not far away.
This chart displays Ethereum’s Open Interest, which is a useful metric for futures market sentiment evaluation. High amounts of open interest indicate higher volatility, and conversely, lower open interest is associated with lower volatility and steady price trends.
This metric has spiked significantly over the past couple of days as the price nears the $2,000 mark. Judging by previous instances, significant rises in open interest are typically followed by bearish corrections or entire trend reversals.
Therefore, a price decline is seeming highly probable at the moment, as a slight drop would lead to a long liquidation cascade and likely result in a considerable plunge in price.
Source: CryptoQuant
The post Can ETH Hit $2,000 Before the Shanghai Upgrade on April 12nd? (Ethereum Price Analysis) appeared first on CryptoPotato.