


Ethereum’s price has dropped below a significant resistance zone where the 100-day and 50-day moving averages and a recently formed channel’s middle boundary had a stronger confluence. Therefore, a possible uptrend will be possible only if the price exceeds this range. Oppositely, a rejection might trigger another bearish leg.
Technical Analysis
By Shayan
The Daily Chart
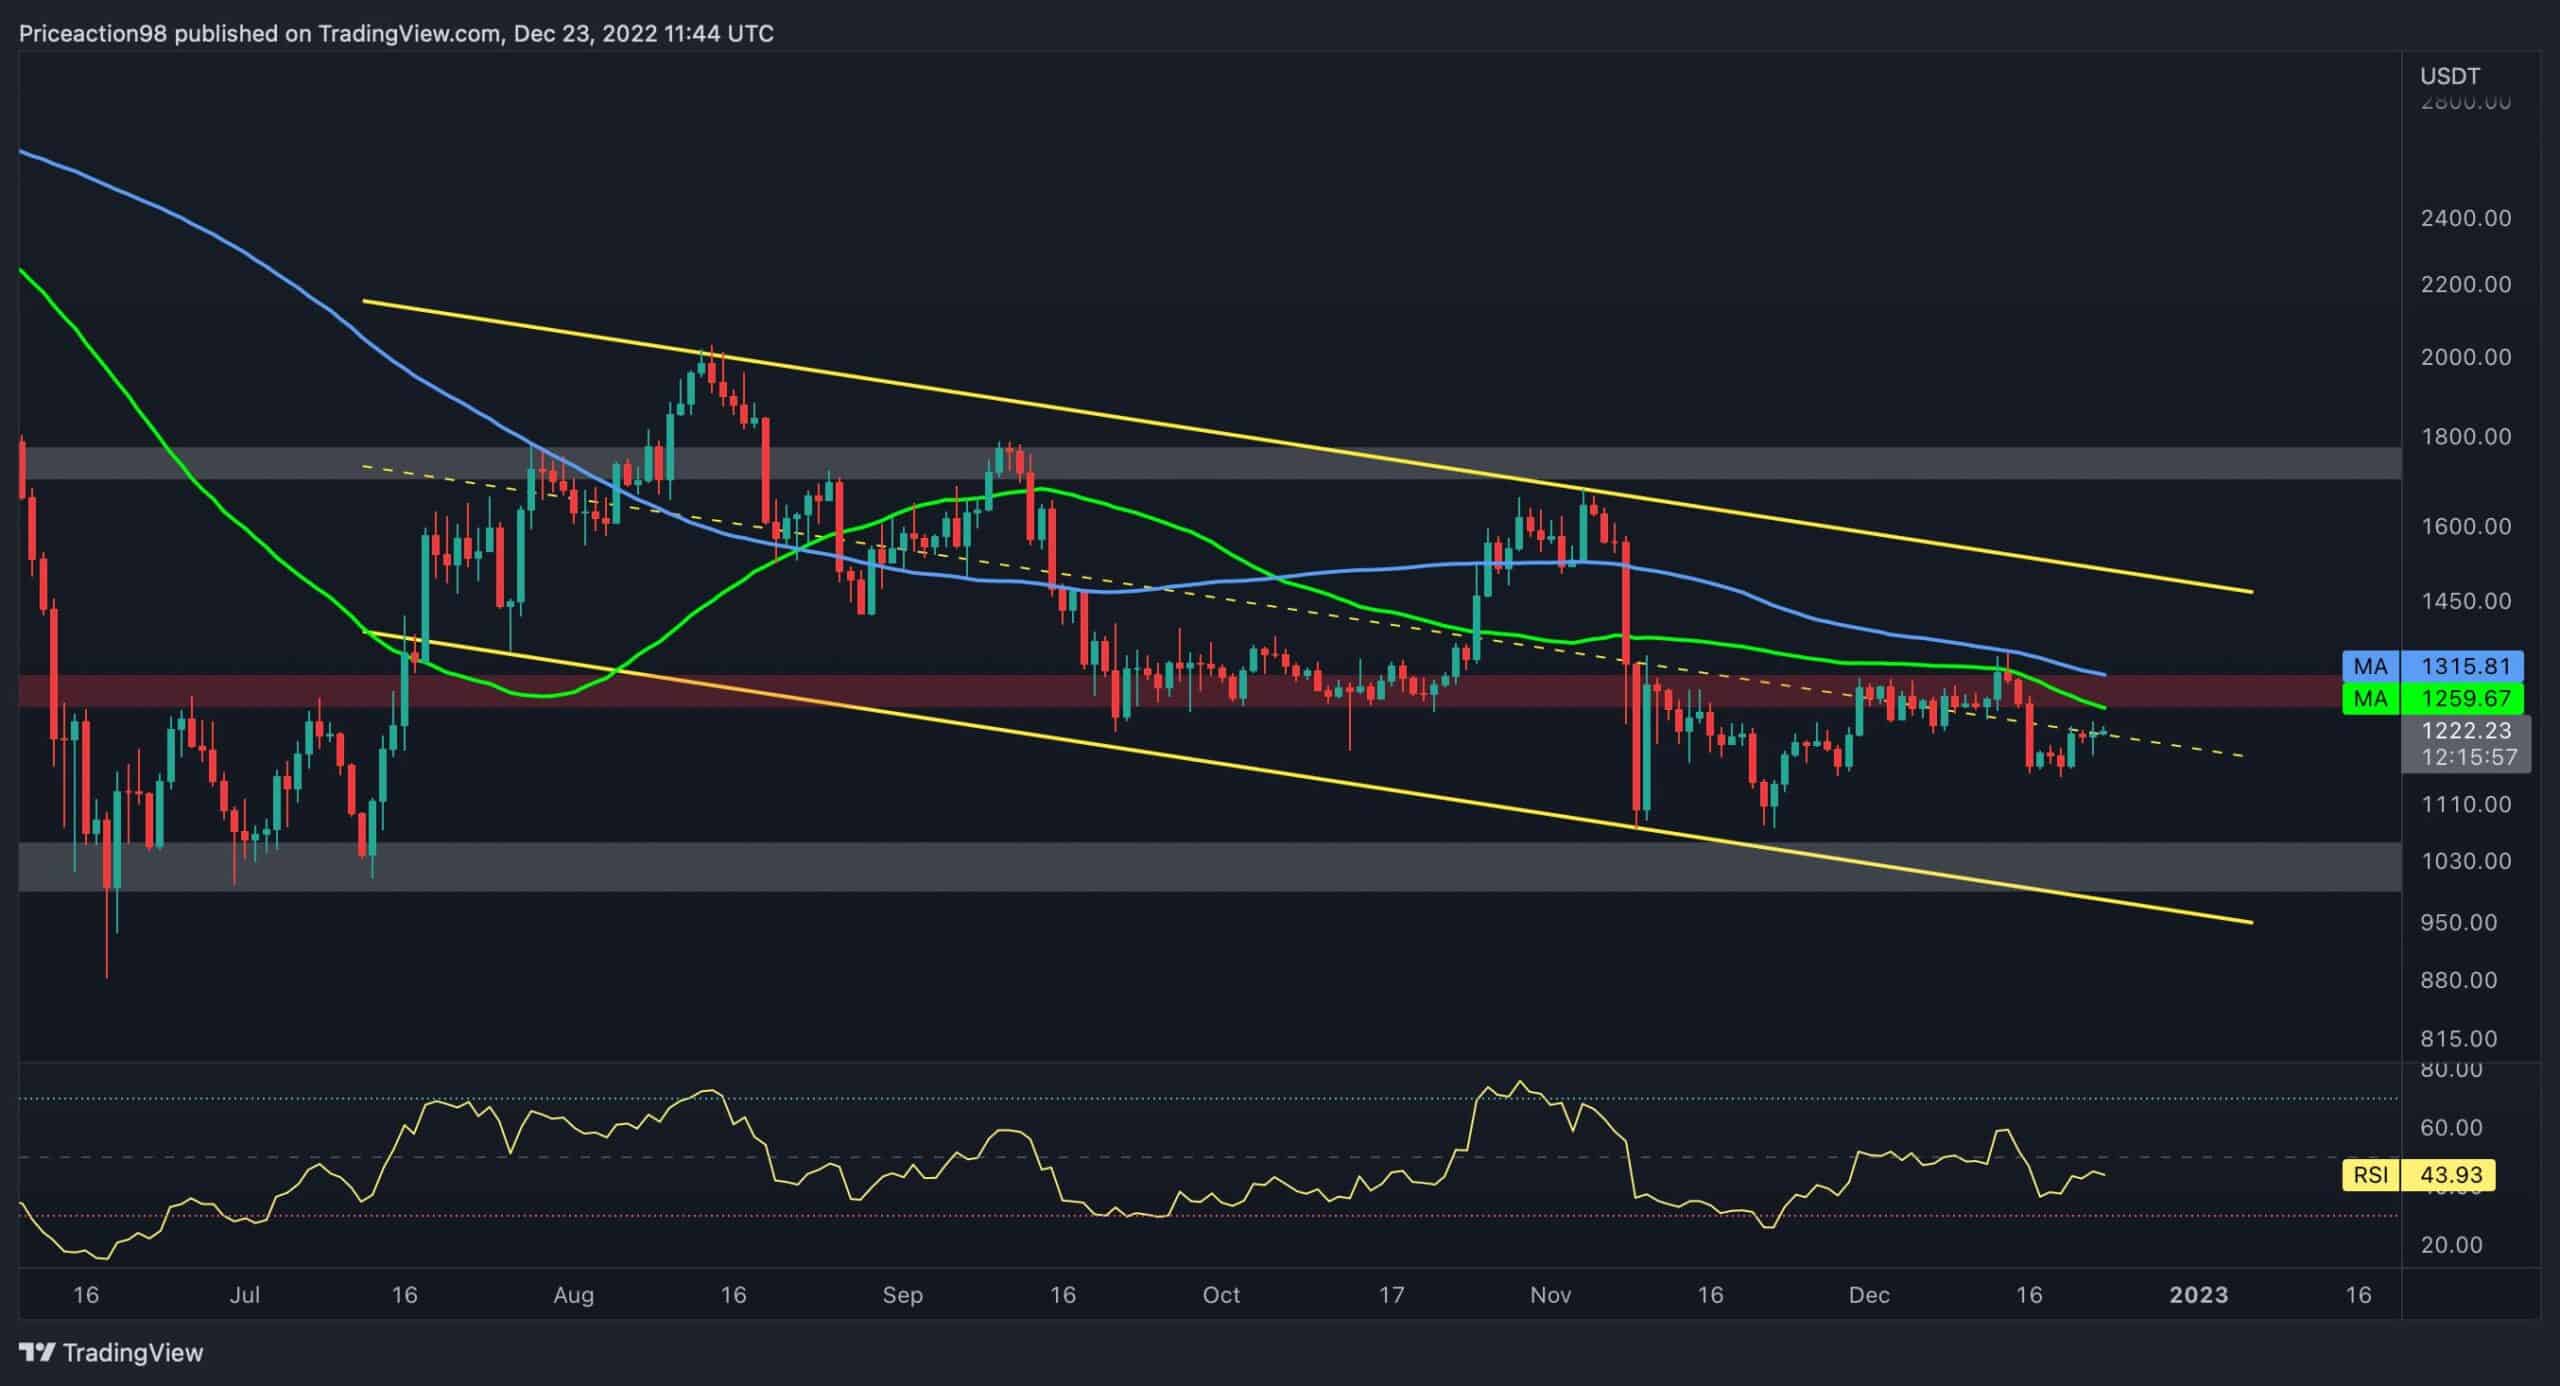
Ethereum’s price has been moving inside a descending price channel for six months. Most recently, the price failed to surpass the 100-day and 50-day moving averages at $1300. As a result, Ethereum plunged below the channel’s middle boundary and is currently attempting to retest it.
The alignment of the 50-day and 100-day moving averages and the static resistance level of $1300 makes this level a decisive one for the cryptocurrency. If the price breaks above the resistance zone mentioned above, the channel’s upper trendline around the $1500 mark would be the main barrier to the price. However, based on the current market sentiment, a drop toward $1000 would be the more likely scenario in the short term.
Source: TradingView
The 4-Hour Chart
In the 4-hour timeframe, the price had experienced an impulsive bearish rally and is consolidating in the form of a well-known continuation correction pattern called an ascending flag. On the other hand, the 0.5-0.618 area of the Fibonacci retracement, standing at $1251-$1275, coincides with the static resistance level of $1260.
Considering the importance of this resistance level and the bearish continuation flag pattern, the potential of getting rejected from the $1251-$1275 region, marking another bearish impulsive move towards the $1000 level, is high. Nevertheless, if the price surpasses the abovementioned level, the bulls could push the price higher.
Source: TradingView
Onchain Analysis
By Shayan
The following chart demonstrates the Exchange Reserves metric alongside Ethereum’s price. The metric has been in a downtrend since July 2020. However, after the massive price crash in November, the Exchange reserves metric experienced a significant decline and dropped to a new low.
Source: CryptoQuant
This indicates that the market participants are offloading their assets from exchanges following the FTX collapse. This results in a substantial market capitulation stage that might finally trigger the last phase of the recent bear market.
The post ETH Needs to Break This Level to Initiate a Rally (Ethereum Price Analysis) appeared first on CryptoPotato.