


Ethereum’s price has reached a key resistance level following the recent rebound and rally from the $1100 area. The short-term price action of ETH now depends on the reaction to this key level.
Technical Analysis
By: Edris
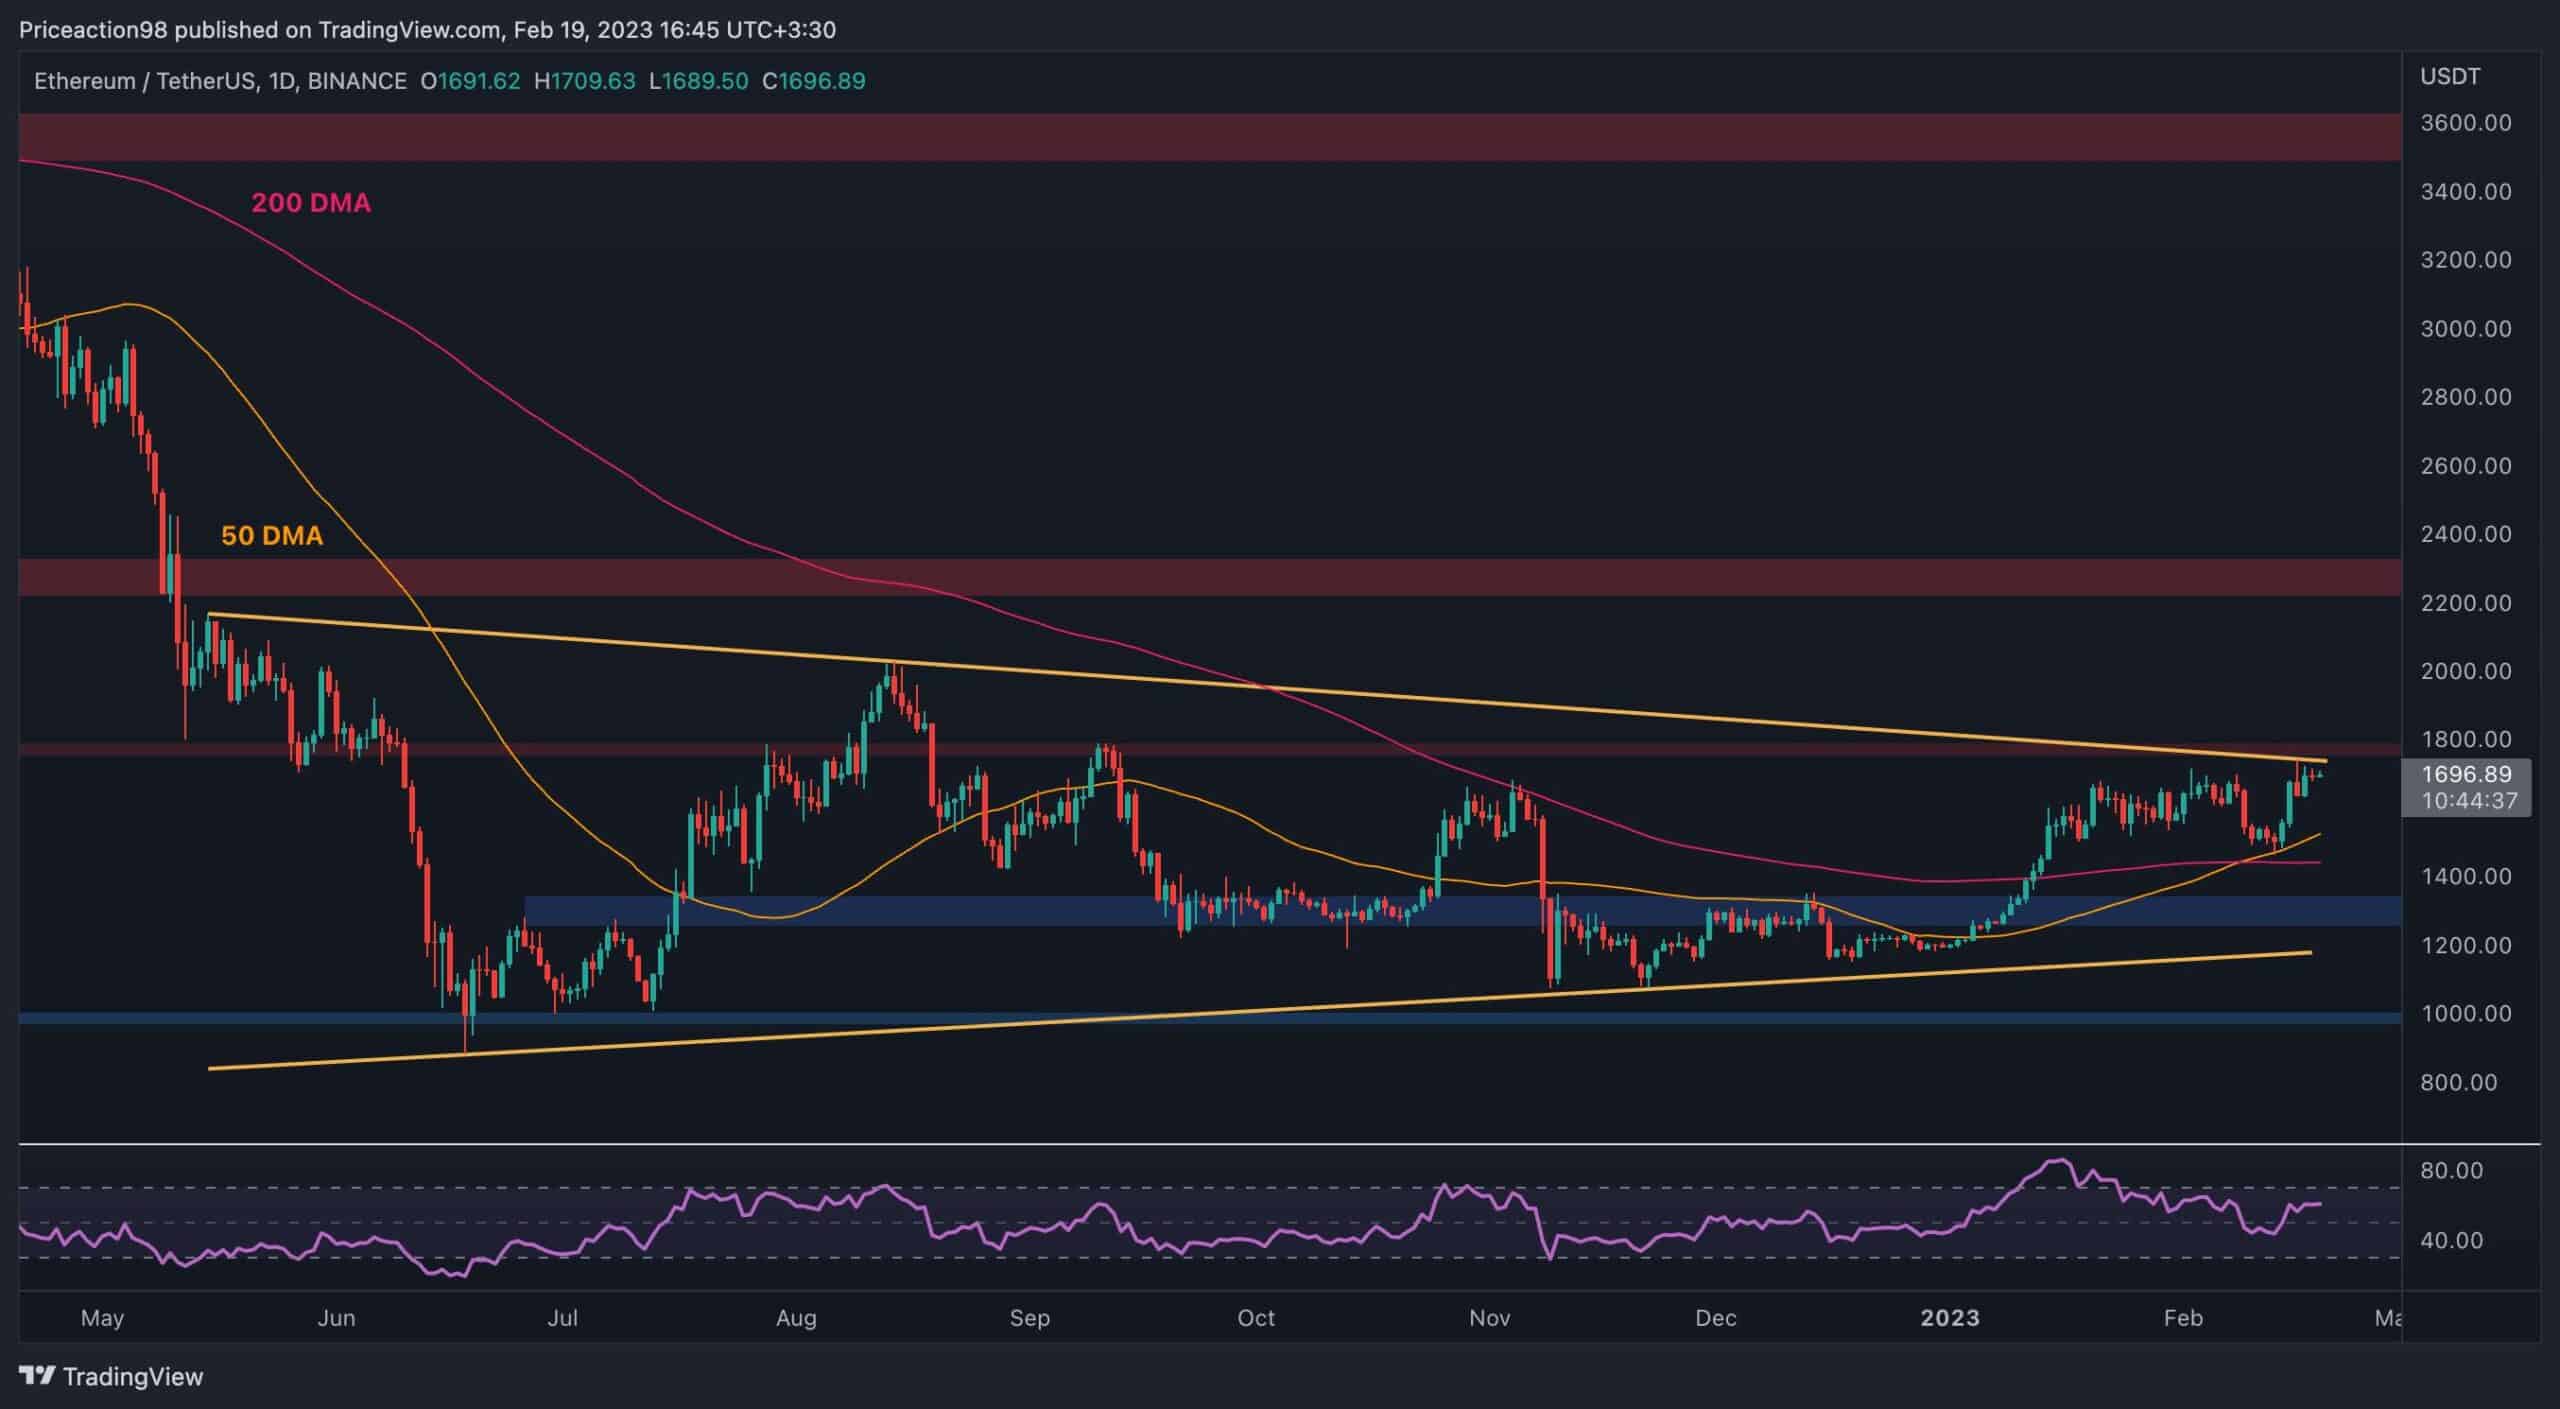
The Daily Chart:
On the daily timeframe, the price has finally reached the higher boundary of the large symmetrical triangle after consolidating for a couple of weeks.
The price tested the $1800 level and the higher trendline of the triangle yesterday but has been rejected. Yet, there is still a considerable probability for the price to break through the mentioned resistance area, which could lead to a rally toward the $2400 mark.
However, in case a bearish pullback occurs, the 50-day and 200-day moving averages could provide support around the $1450-$1500 range, respectively.
Source: TradingView
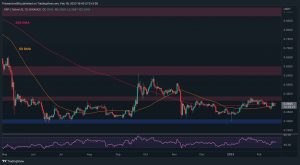
The 4-Hour Chart:
Looking at the 4-hour chart, the price has been rejected from the higher boundary of the triangle with high precision. Currently, the market is testing the $1680 level, which has turned into support after being broken to the upside.
In case the $1680 level fails to hold the price, the $1500 range would be the next likely target for a deeper pullback.
The RSI indicator, which has signaled a potential rejection with a clear overbought signal, is still showing values above 50, demonstrating that the bulls are still in control, and a bullish continuation may be the more probable outcome.
However, the current structure can change drastically if the RSI drops below 50 and the price breaks the $1500 level to the downside. In this case, a deeper decline toward the $1350 support level would be expected.
Source: TradingVIew
The post ETH Soars 10% Weekly, is $2K Imminent? (Ethereum Price Analysis) appeared first on CryptoPotato.