


After a prolonged period of consolidation without a clear direction, the cryptocurrency market has finally undergone a correction, with most coins decreasing in value. Ethereum was no exception, as its price has plunged by 14%, hitting a significant support zone.
Technical Analysis
By Shayan
The Daily Chart
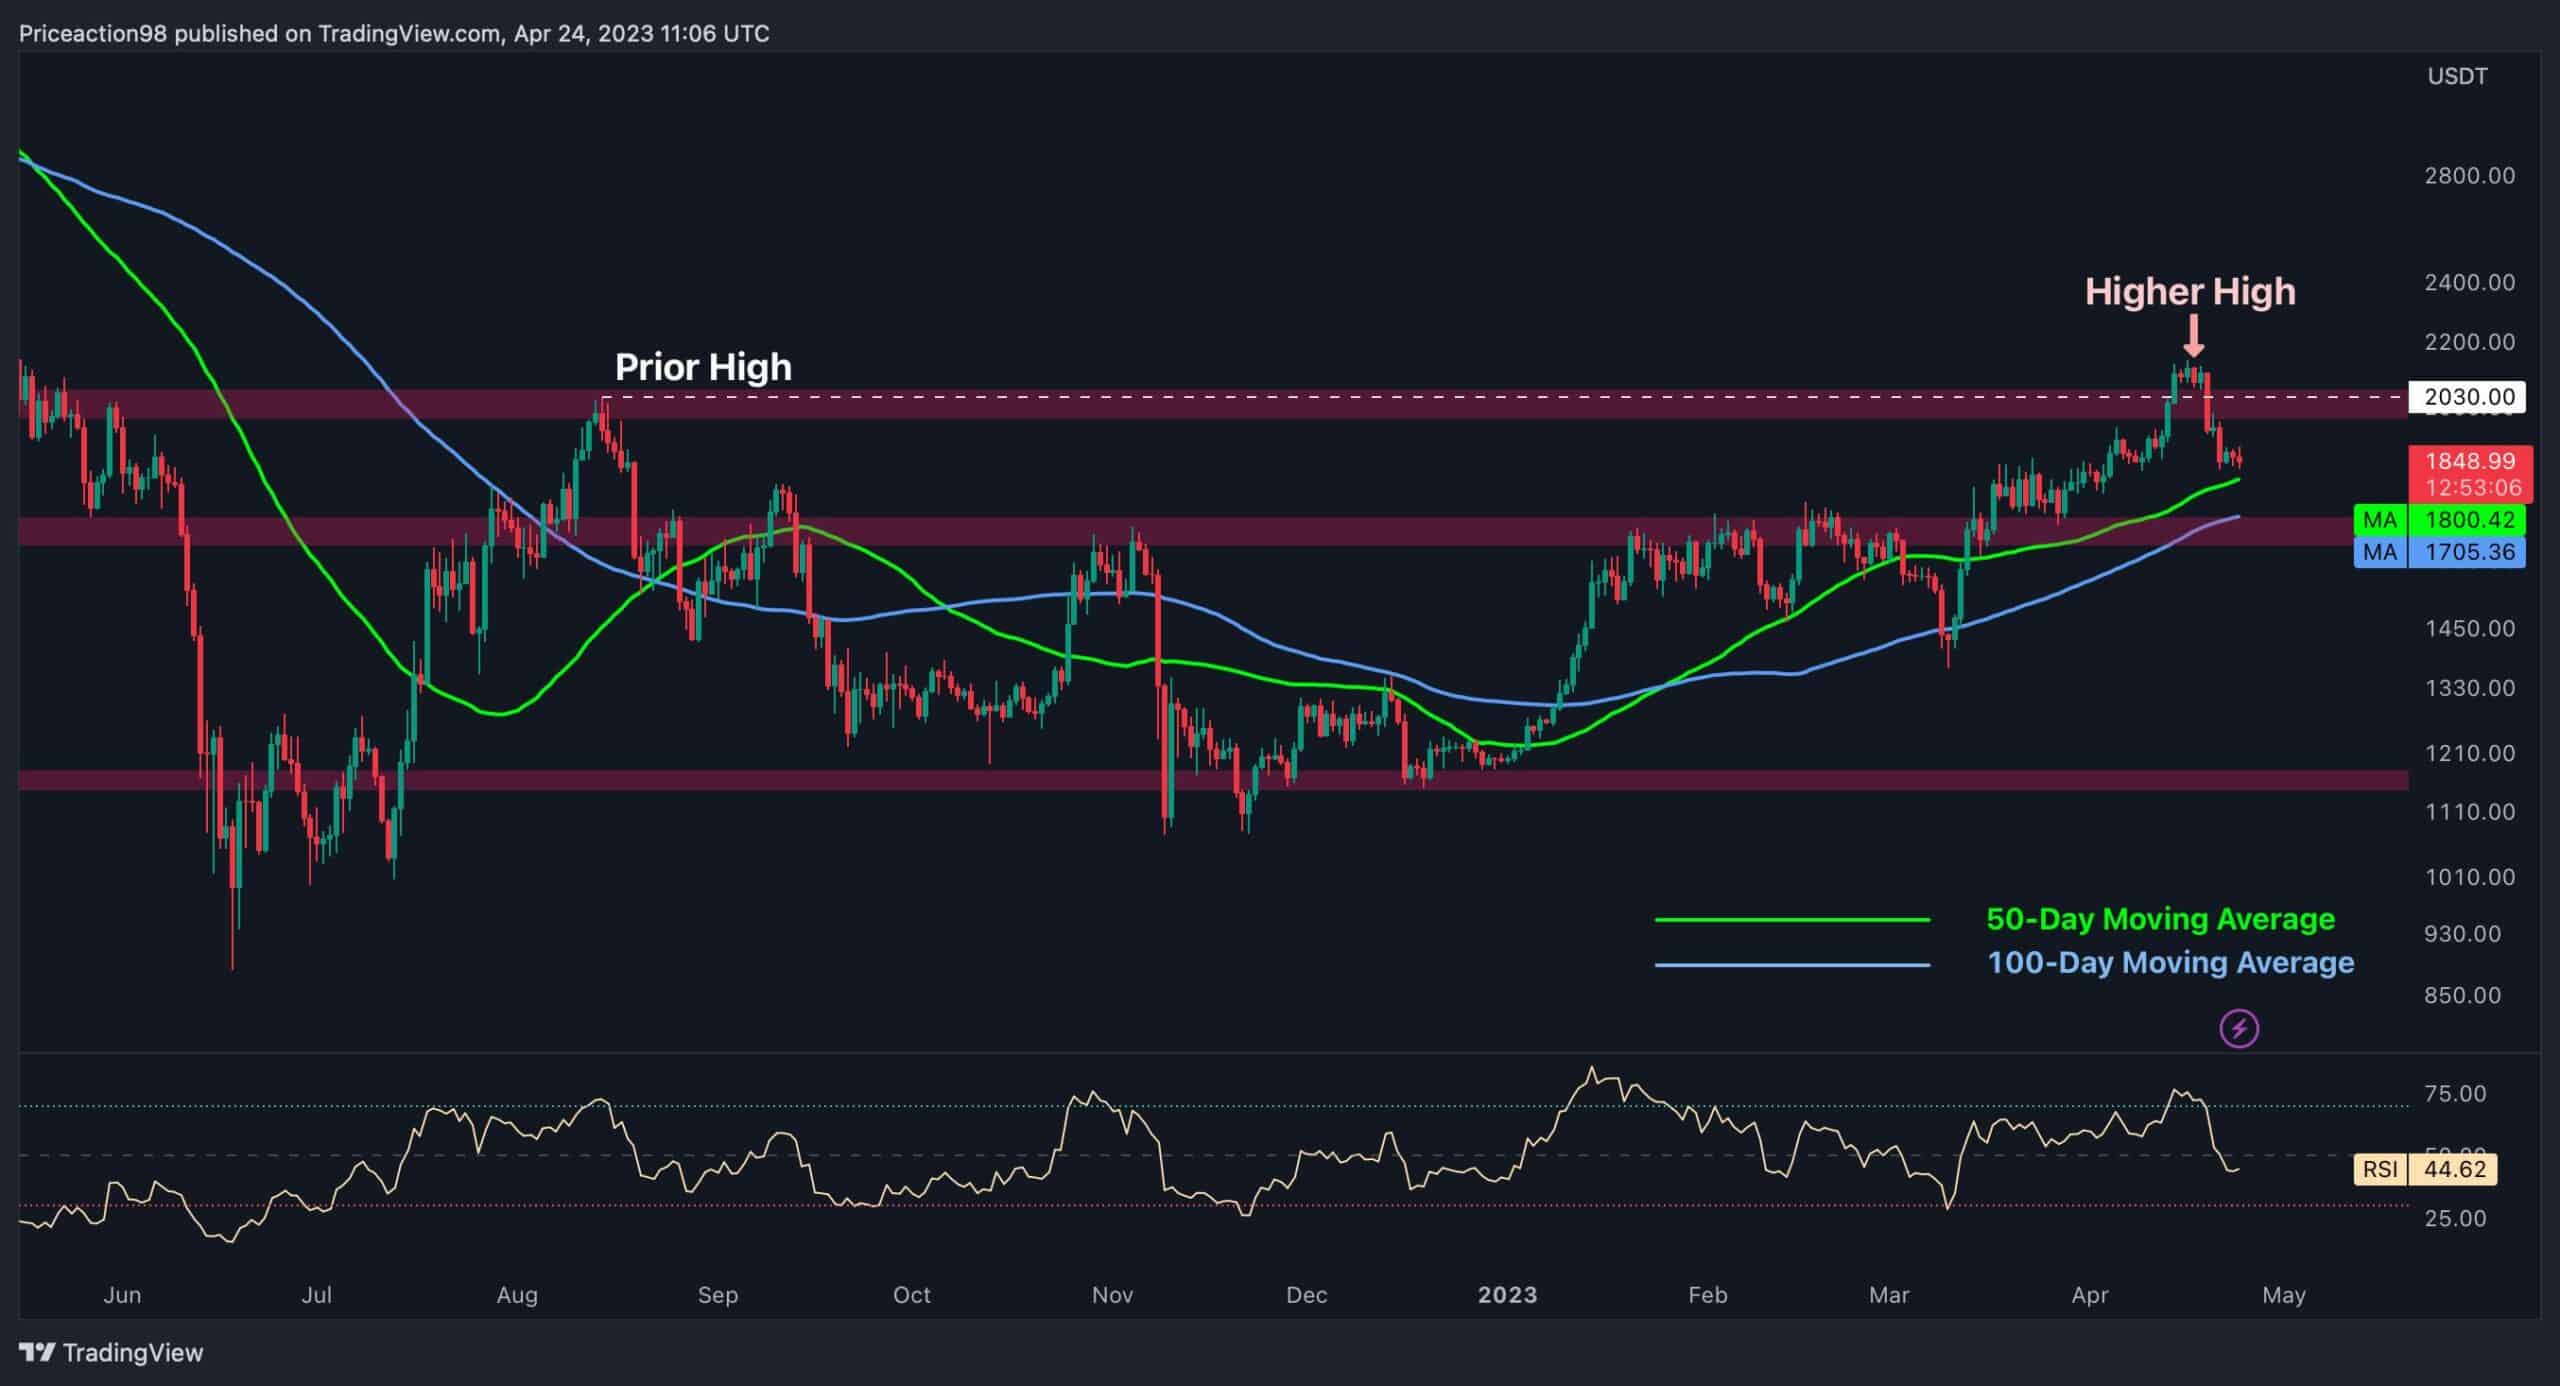
Ethereum recently surpassed its prior major swing high at $2K due to its impulsive uptrend, providing a significant bullish sentiment by indicating a positive trend reversal. However, the price quickly formed a head-and-shoulder reversal pattern and was rejected, resulting in a 14% plummet.
Nevertheless, the price has now arrived at a crucial support region comprising the 50-day moving average of $1800 and the 100-day moving average of $1705.
Therefore, the price action within the $1.7K-$1.8K range must be closely monitored since a breakout from this critical support zone will likely determine Ethereum’s near future direction. If the cryptocurrency falls below this vital area, its previous major swing low at $1.4K will serve as the primary support for the price in the mid-term.
Source: TradingView
The 4-Hour Chart
According to the 4-hour timeframe, Ethereum’s price rally came to an end when it attempted to break out of the channel’s upper trendline at $2.1K. As a result of an impulsive decline, Ethereum’s price has now reached the middle boundary of the channel, a significant support/resistance region, and is struggling to break it downward.
If the price falls below this level, it could trigger a downtrend toward the $1.7K mark. However, if the cryptocurrency finds support and reverses the downtrend, a rally toward the upper threshold will be the most probable scenario for Ethereum in the short term.
Source: TradingView
The post Here’s the Critical Support for ETH Following a 14% Weekly Plunge (Ethereum Price Analysis) appeared first on CryptoPotato.