


Bitcoin’s price is once again found in limbo, unable to make a decisive move in either direction. This happens as volatility thins out while volume declines across the board.
The most recent price action, however, has also created a popular technical pattern – one that was also present in the bear market of 2018.
More Pain to Come for Bitcoin’s Price?
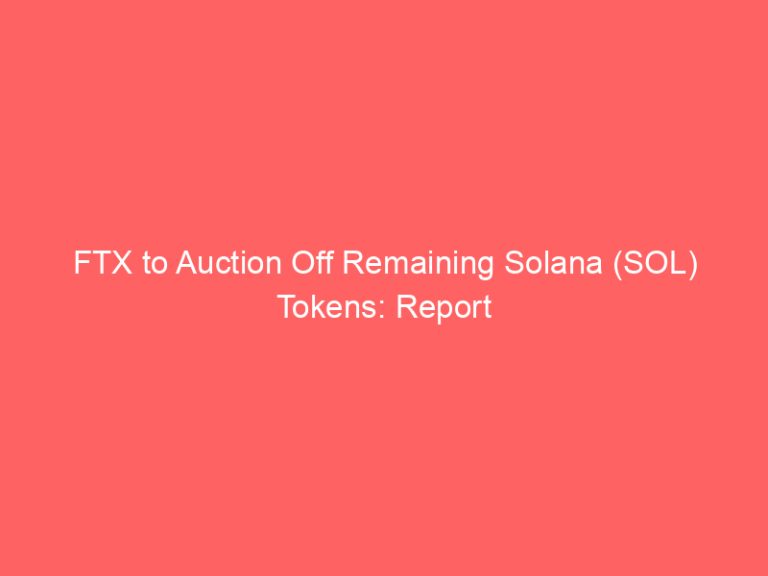
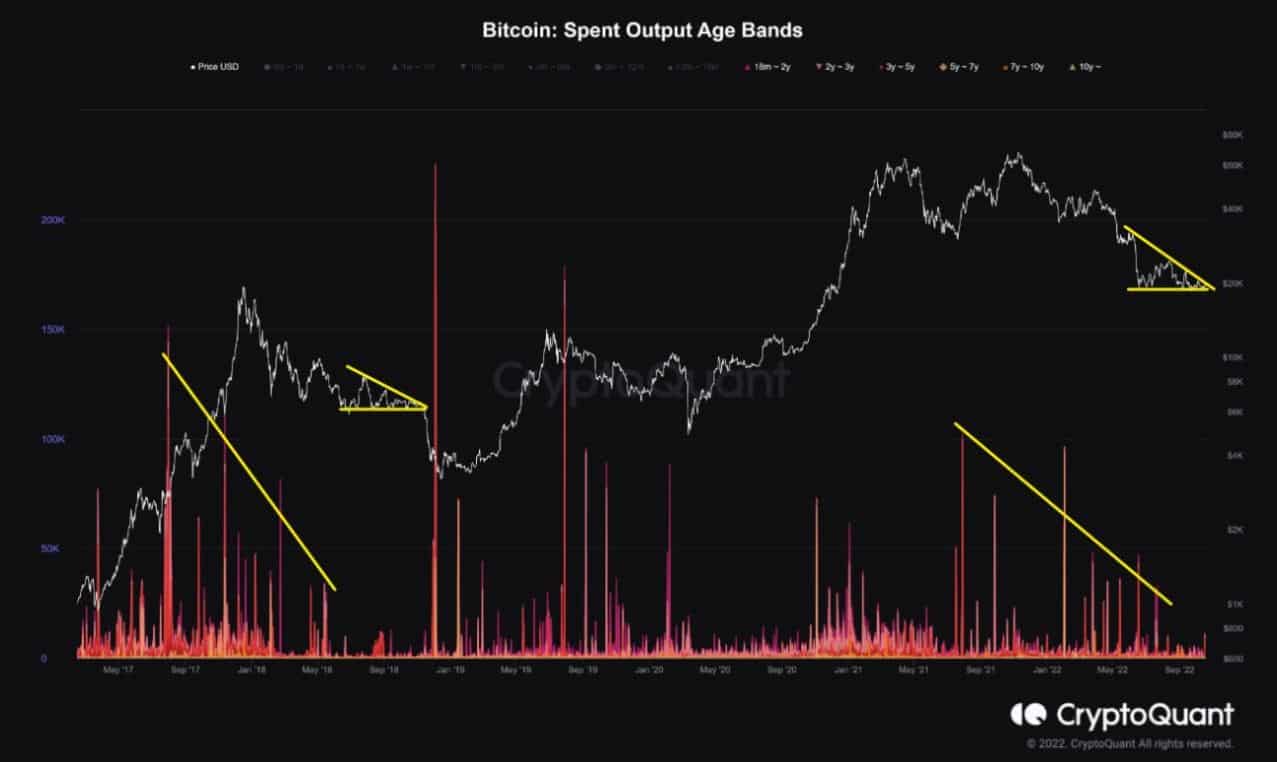
According to an analyst from CryptoQuant, the BTC price is forming a very similar technical pattern to that in 2018’s bear market.
Other conditions are also relatively similar, including declining volume and volatility.
The movement of long-term hold bitcoins has decreased, and price volatility is becoming very low.
If the current descnending triangle pattern is completed and the price deviates from the support line, there is a possibility of a last crash in the bear market.
Source: CryptoQuant
At the time of this writing, Bitcoin’s price is trading slightly above $19,000. It declined from yesterday’s high at around $19,700, unable to break the coveted resistance at $20K.
BTC Primed for Explosive Move
Another popular analytics resource, Glassnode, argued that Bitcoin’s market is primed for an outburst and that it’s currently in a state resembling a “coiled spring.”
Multiple reasons led to that conclusion, including but not limited to:
The continuation of Bitcoin’s price consolidation
Weekly aSOPR approaching breakeven values
Off-chain volatility brewing
Additionally, the fact that Bitcoin’s price is trading relatively close to the critical resistance level of $20K makes it more likely that volatility will pick up.
However, the analytics resource failed to provide a directional prediction, arguing that the market can turn either way.
Meanwhile, the BTC market sentiment remains in a state of extreme fear, according to AlternativeMe. It has improved ever-so-slightly in the past couple of days, but it remains close to the cycle’s lows when zoomed out to a 1-year period view on the chart:
Source: AlternativeMe
The post More Blood Incoming? Bitcoin Charts Similar Crash Pattern as in 2018’s Bear Market appeared first on CryptoPotato.