


Ethereum’s price recently received support at the 200-day moving average and subsequently embarked on a strong bullish rally, breaking above the 100-day MA. This could be a positive indicator for Ethereum’s mid-term prospects, but it also carries the risk of being a bull trap.
Technical Analysis
By Shayan
The Daily Chart
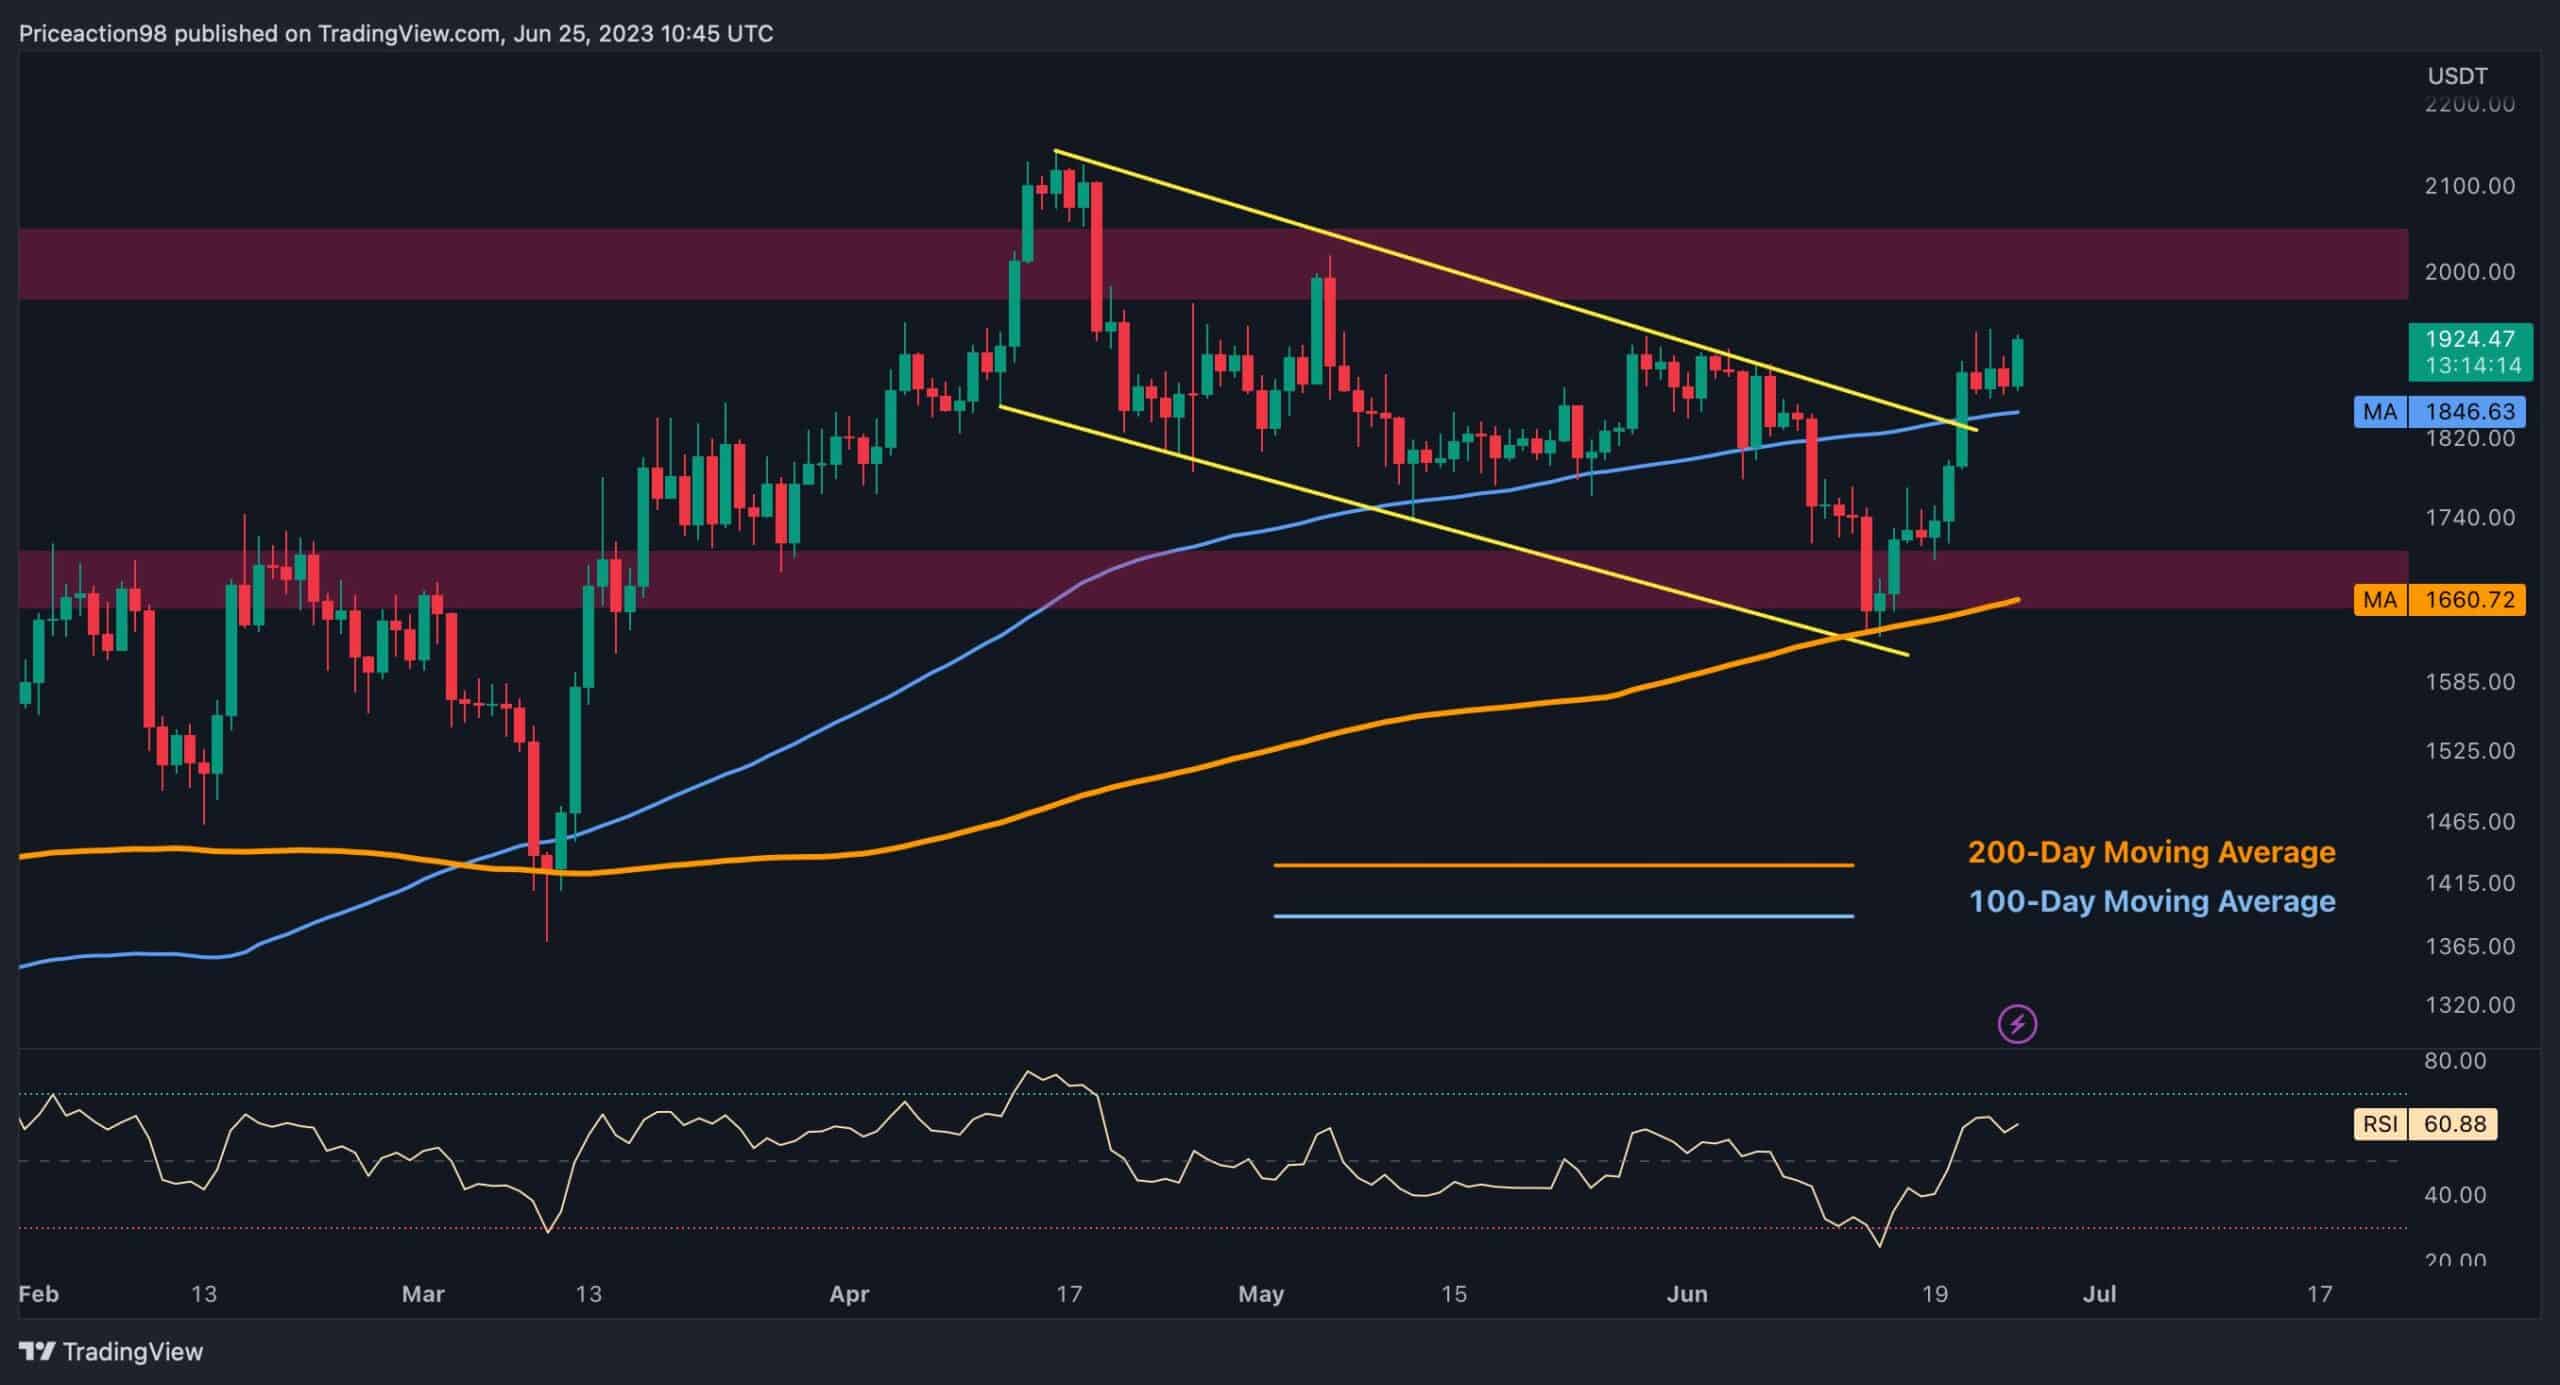
After a period of correction and a significant downtrend, the price reached the $1.6K level, which coincided with the 200-day moving average and found support. The significant buying pressure at this level triggered a rapid reversal and an upward trend toward the critical resistance zone around $2K.
Additionally, the price surpassed the 100-day moving average at $1.8K, suggesting a bullish bias for Ethereum in the mid-term. However, to confirm the presence of a bull market in 2023 and restore sufficient demand to the market, Ethereum’s price still needs to overcome the substantial resistance at the $2K region and consolidate above.
Source: TradingView
The 4-Hour Chart
In general, the Fibonacci retracement tool is helpful for identifying potential reversal points and correction targets during impulsive trends. As previously mentioned, Ethereum’s price experienced a mid-term correction phase after reaching the yearly high of $2.1K through an impulsive uptrend.
Examining the chart reveals that the bearish correction leg found support and reversed at the 61.8% retracement level, a commonly observed target for correction phases. The prevailing buying pressure within this critical range resulted in a robust bullish trend towards the $2K region.
If the price successfully surpasses the significant resistance around $2K, it will pave the way for a mid-term bullish trend, as this level holds psychological significance. However, it is worth considering the bearish divergence between the price and the RSI indicator, which suggests the possibility of a slight rejection and short-term consolidation before Ethereum makes its next move.
Source: TradingView
On-chain Analysis
By Shayan
Ethereum has been consolidating below the $2K level for the past few months after being rejected from that level. The uncertainty seen on the price chart is also reflected in the futures market sentiment.
This chart displays the Funding Rates metric, which indicates whether the futures market sentiment is bullish or bearish. Recently, after a period of correction in the market, which coincided with a downtrend in the funding rates metric, the price found support and began a strong rally.
However, the metric has started to show a slight uptrend during this bullish rally, suggesting increased buying pressure and a greater tendency among participants to take long positions rather than short positions.
While this could be seen as a bullish sign for the market, traders should exercise caution as it may actually be a bull trap, potentially leading to a long-squeeze event.
Source: CryptoQuant
The post ETH Bulls Aim at $2K But is a Retest of $1.8K Coming First? (Ethereum Price Analysis) appeared first on CryptoPotato.