


Ethereum has been consolidating within a narrow price range, tightly bound by the upper limit of the descending flag pattern and the 100-day moving average. However, a breakout is imminent and will determine the subsequent direction of the cryptocurrency.
Technical Analysis
By Shayan
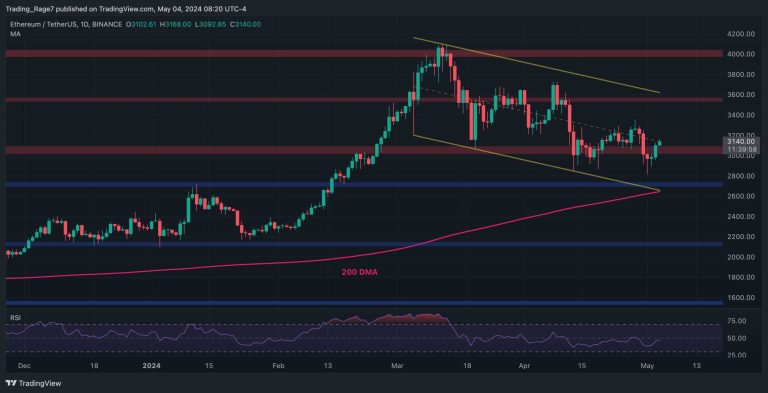
The Daily Chart
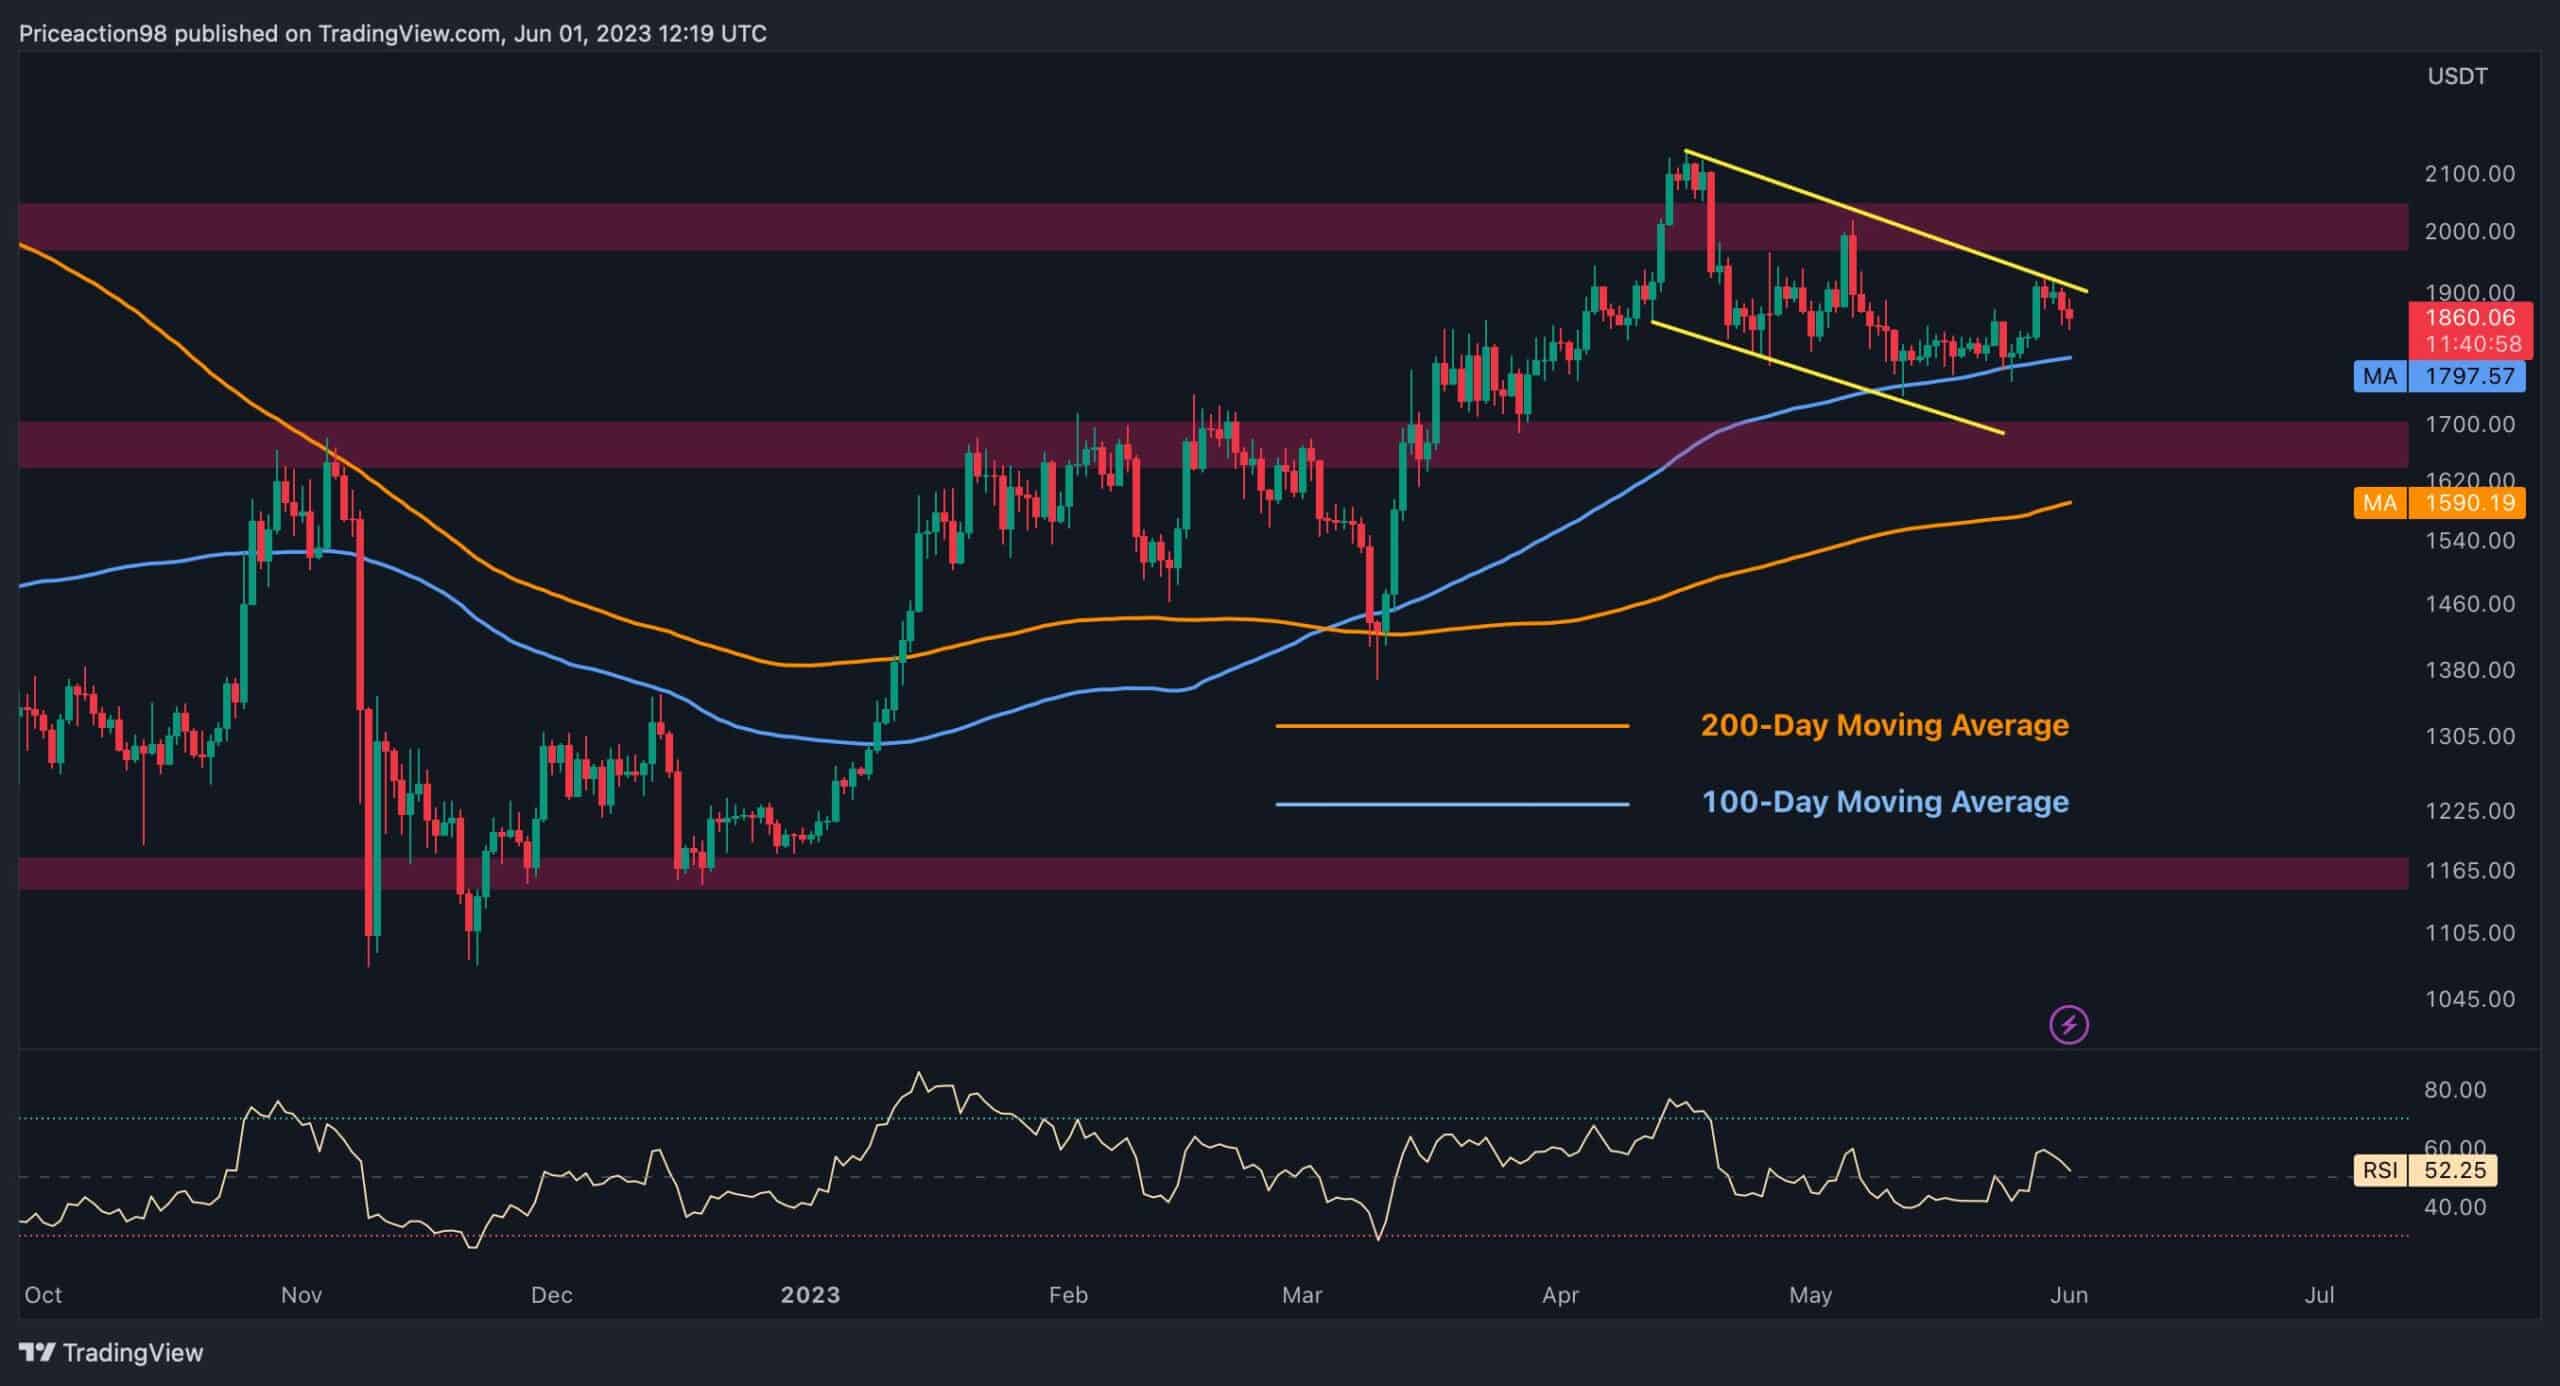
Examining the daily chart, Ethereum demonstrated a period of stable price action around the $1790 mark, near the 100-day moving average, before gaining support and embarking on an upward trajectory.
Despite an unsuccessful attempt to breach the flag’s upper boundary at $1.9K, resulting in a minor correction, Ethereum’s price remains confined within a limited range, approximately between the $1791 level of the 100-day moving average and the dynamic resistance offered by the flag’s upper trendline. A breakout from the flag pattern is likely to initiate another rally toward the $2K resistance zone.
Source: TradingView
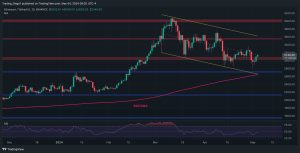
The 4-Hour Chart
Taking a closer look at the 4-hour chart, three significant price regions present challenges for Ethereum buyers and sellers: the static resistance at $2K, the dynamic resistance from the mid-trendline of the ascending channel, and the dynamic support provided by the channel’s lower threshold.
Considering the ongoing price action, it might seem more likely that Ethereum will continue its upward trend, aiming to surpass the $2K resistance level. However, given the current market conditions and prevailing uncertainty among market participants, it is more probable that a consolidation phase will occur first between the $2K region and the lower boundary of the channel.
Source: TradingView
The post ETH Remains Uncertain But $2K Seems a Likely Target: Ethereum Price Analysis appeared first on CryptoPotato.