


After a prolonged period of silence near the critical $30K threshold, the price has encountered significant rejection, resulting in a swift and rapid decline.
However, the current scenario shows the price consolidating close to the crucial support range of $25K, where it could potentially find a bottom and halt further downtrends.
Technical Analysis
By Shayan
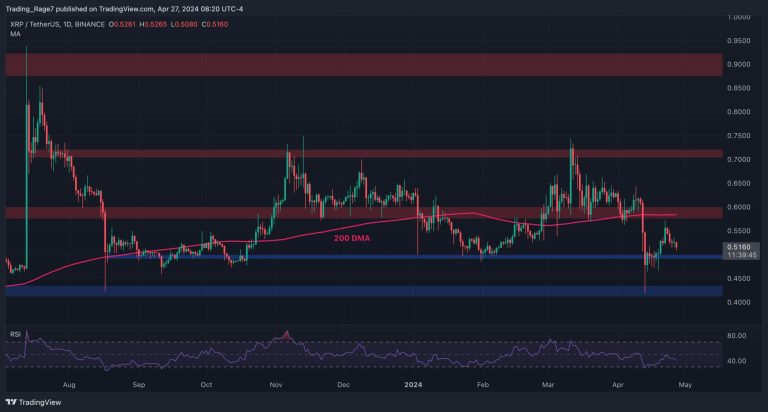
The Daily Chart
Following a minor corrective phase, where a bearish divergence occurred between the price and the RSI indicator, Bitcoin experienced a forceful rejection and underwent a rapid drop. This recent decline caused the price to breach a significant and pivotal support area encompassing the 100-day and 200-day moving averages, indicative of an overall bearish sentiment in the market. Subsequently, the cryptocurrency dipped and arrived at the pivotal support zone of $25K.
However, the price action within this critical support zone carries substantial significance, as the $25K level has long served as crucial psychological support. Therefore, if it receives support and witnesses an upsurge in buying activity, market participants could potentially anticipate a reversal.
Conversely, without such support, the price might breach this mentioned support level, potentially triggering a cascading effect that drives it toward the notable support area at $20K.
Source: TradingView
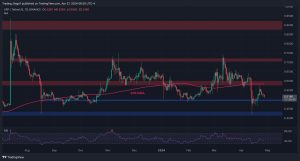
The 4-Hour Chart
Shifting attention to the 4-hour chart, it becomes evident that the price is confined within a static range, oscillating between the notable resistance at $30K and the significant support at $25K. Following a swift descent from the $30K resistance zone, BTC has now approached the lower threshold of the range, resting near the $25K support area.
Despite this decline, the $25K support level holds the potential to stave off further short-term declines due to the existing demand around this crucial range. Consequently, a positive response within this defined range could potentially pave the way for a fresh upward trajectory, propelling the price toward the substantial resistance level at $30K.
Conversely, if the price dips below the $25K mark once again, the market might embark on an extended bearish phase, leading to a further decline toward lower support regions.
Source: TradingView
On-chain Analysis
By Shayan
The “Exchange Whale Ratio” gauges the ratio between the top 10 significant inflows and the total inflow volume on cryptocurrency exchanges. Elevated values of this metric indicate substantial funds from prominent players, commonly known as “whales,” being transferred into exchanges.
Presently, the Exchange Whale Ratio has surged after marking its lowest point since February 2018, simultaneously with the price experiencing a rapid decline. While a low ratio might not have an immediate impact, historical trends reveal that its rebound often exerts a negative influence on the price of Bitcoin.
Accordingly, back in February 2018, as the ratio rebounded from an all-time low, the price of BTC hit its peak and subsequently embarked on a decline. This emphasizes that a sudden surge in the ratio could potentially indicate a downward trajectory for BTC’s price.
Source: CryptoQuant
The post How Low Can BTC Go Following the 11% Weekly Crash? (Bitcoin Price Analysis) appeared first on CryptoPotato.