


CryptoVizArt
How Low Can XRP Plummet if $0.50 Support is Lost? (Ripple Price Analysis)
Ripple’s price is continuing its downward momentum on both the USDT and BTC pairs. According to technical analysis, the price is yet to reach a potential turning point on either chart.
Technical Analysis
By TradingRage
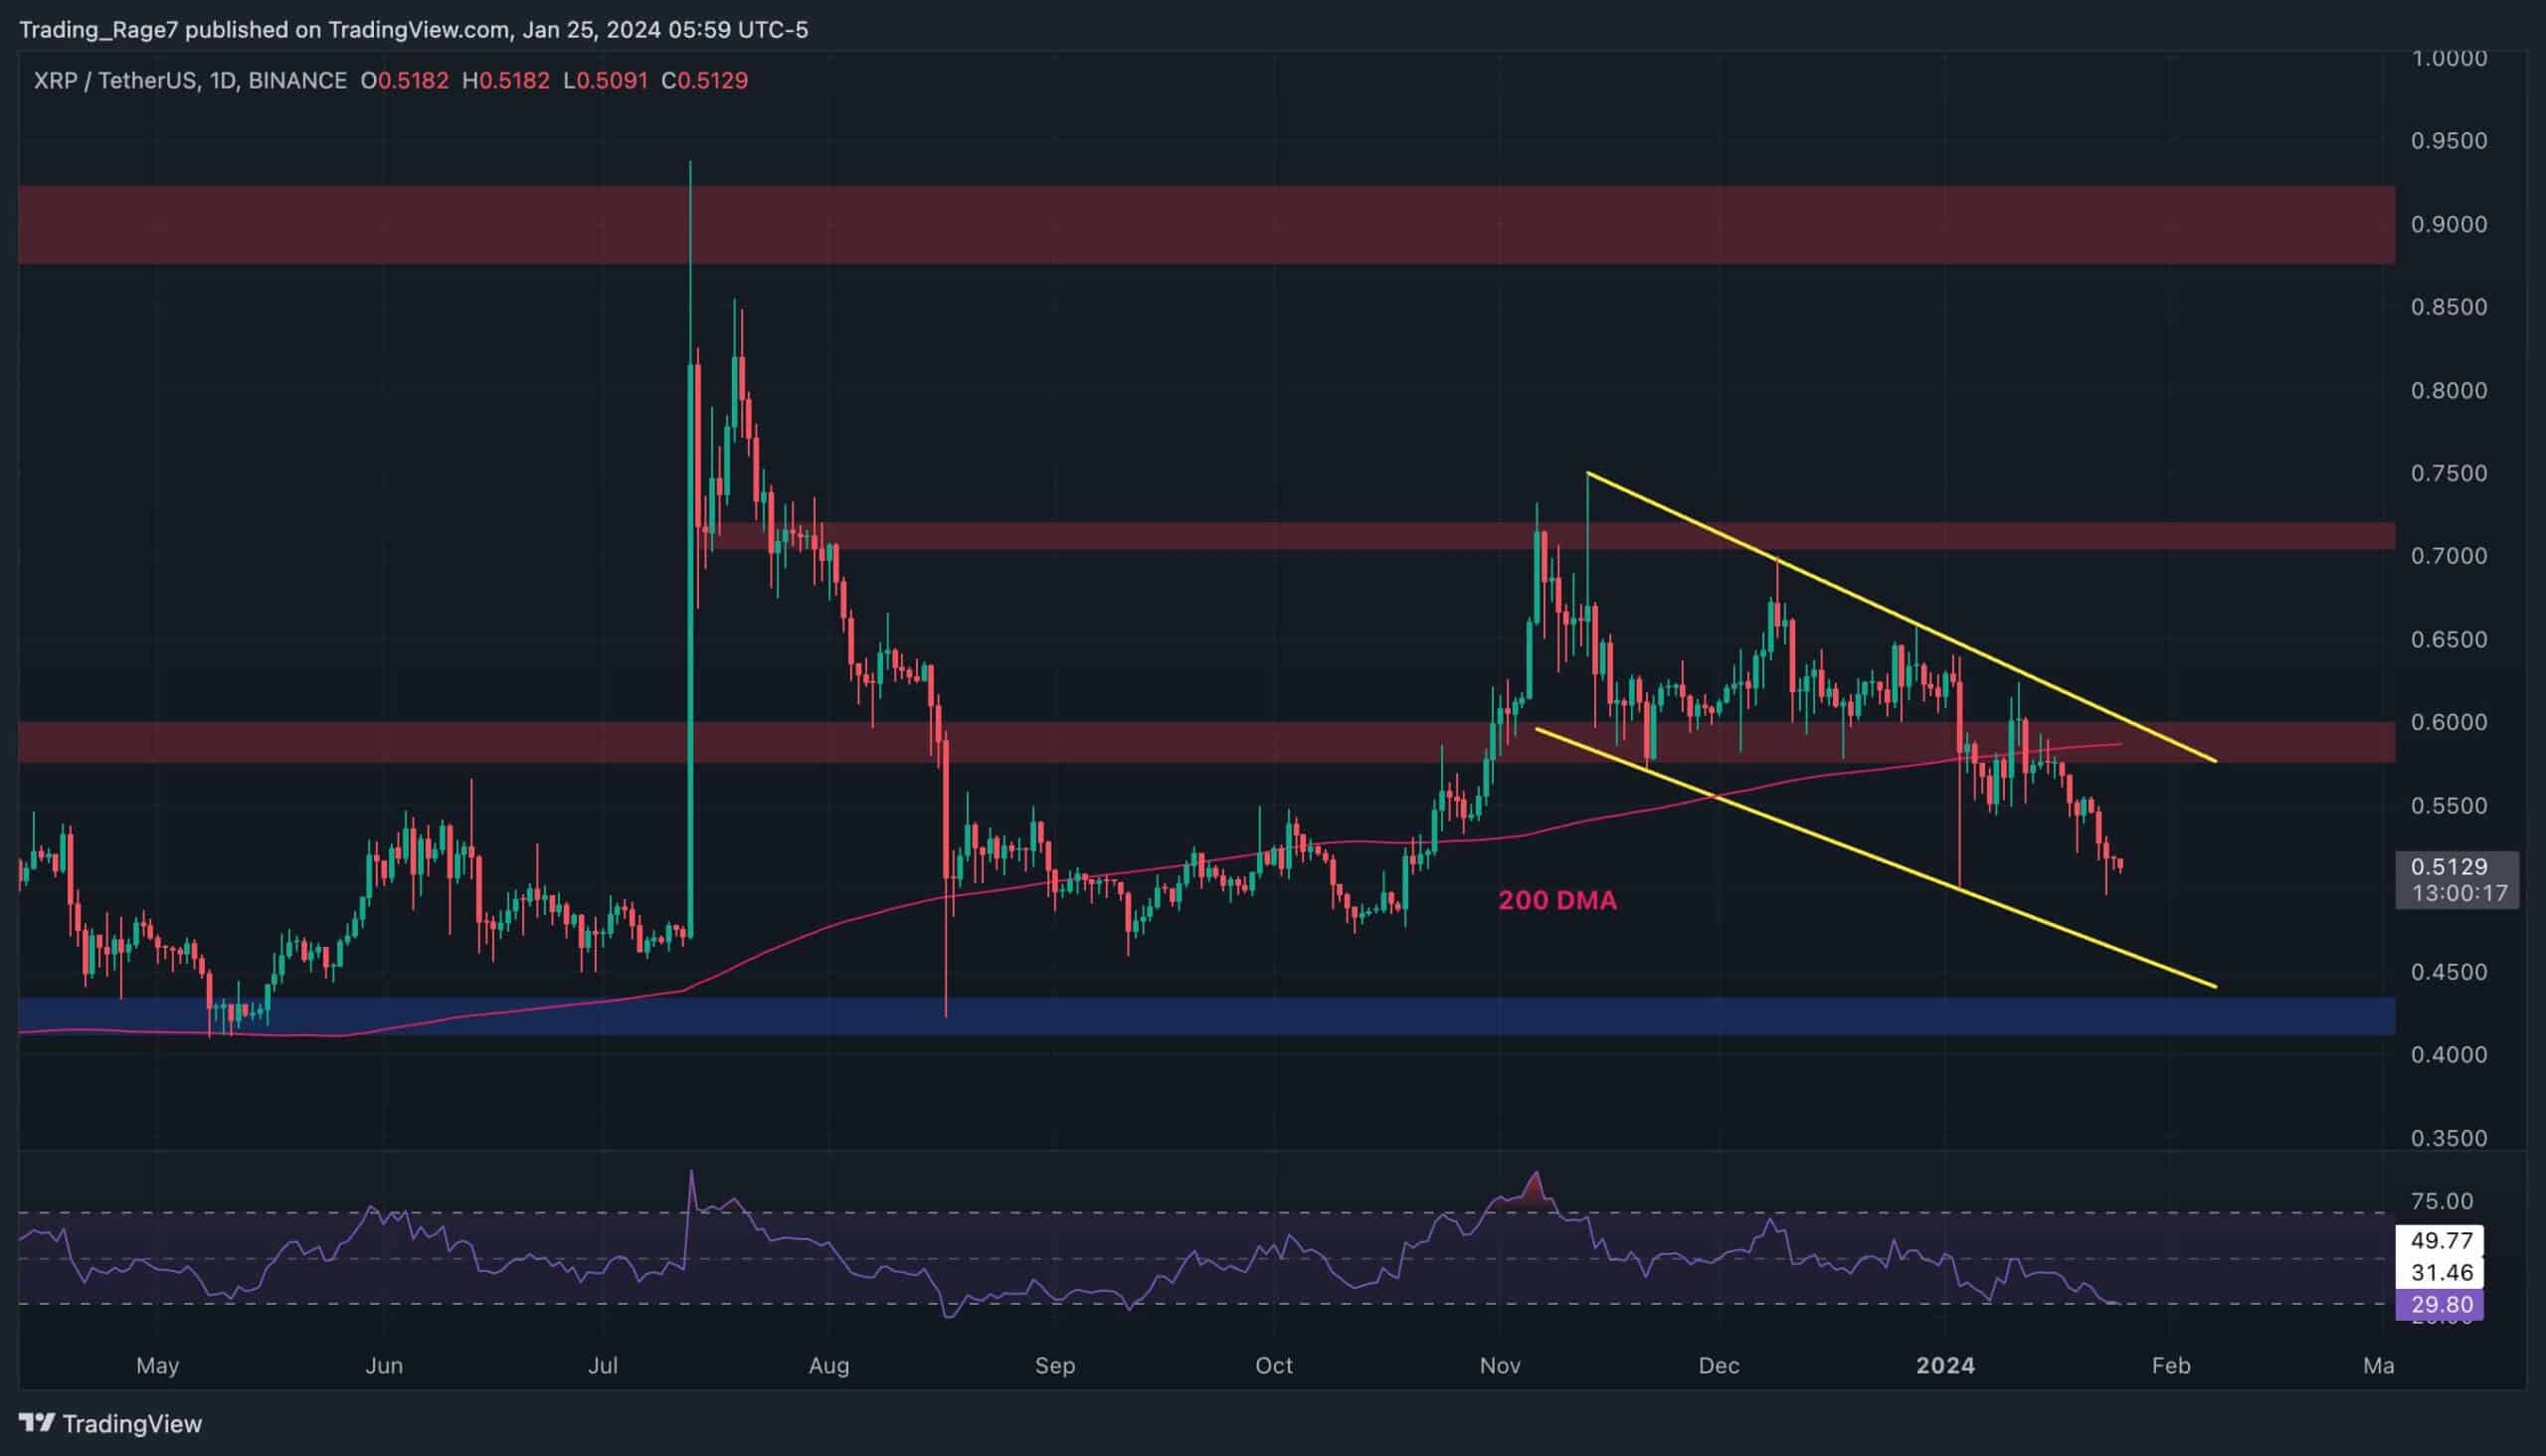
Ripple Price Analysis: The USDT Paired Chart
Against USDT, the price has been trapped inside a descending channel over the last few months. Since the breakdown of the 200-day moving average (currently located around the $0.60 mark), the market has been dropping consistently.
However, XRP has yet to reach significant support. While the Relative strength index is entering the oversold region, the market is unlikely to rebound before retesting the channel’s lower boundary.
The BTC Paired Chart
Things are looking quite similar against BTC. The price has gradually declined inside a large falling wedge pattern since topping in July. The market is currently retesting the 1300 SAT support level but has not shown any willingness to rebound higher.
In case of a breakdown, the lower boundary of the falling wedge pattern would be the next target in the short term. The bearish continuation scenario seems probable,Ripple with the Relative Strength Index showing values below 50%.

The post How Low Can XRP Plummet if $0.50 Support is Lost? (Ripple Price Analysis) appeared first on CryptoPotato.