


Bitcoin experienced an unanticipated decline from the $29K mark, leading to a substantial breakdown of the pivotal 100-day and 200-day moving averages. Following the bearish trend, how low can BTC go?
Technical Analysis
By Shayan
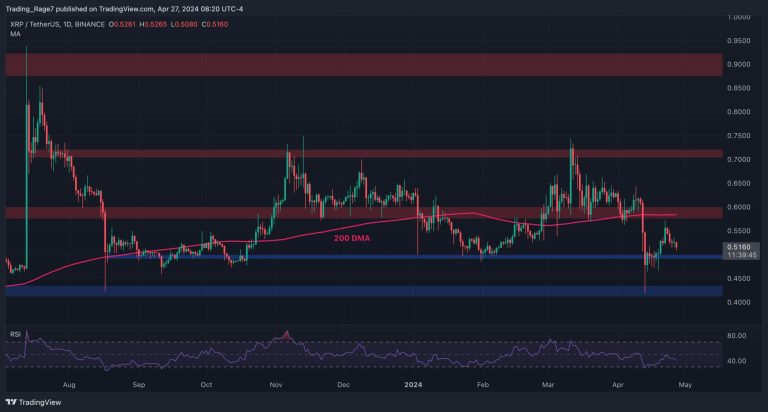
The Daily Chart
After plummeting from the $29K threshold, Bitcoin’s price dropped below the critical 100-day and 200-day moving averages, finding support amid the significant $25K level, where a bounce was initiated.
This sudden upward surge was a direct response to developments in the SEC-Grayscale case, wherein Grayscale secured a favorable court ruling regarding the transformation of GBTC into a Bitcoin ETF.
However, this initial rebound was followed by a retracement to retest the 200-day moving average, leading to another impulsive downward movement that once again reached the crucial support zone at $25K.
While this price action does signal a pronounced bearish sentiment in the market, it’s important to note that a potential re-confirmation of support could pave the way for another bullish rebound, potentially transitioning the market into a consolidation phase. Conversely, the prospect of a cascade becomes likely should the price dip below the $25K mark.
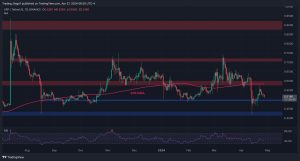
The 4-Hour Chart
Looking at the 4-hour timeframe, it becomes evident that the downward trajectory came to a halt when Bitcoin arrived at the significant $25K support region, leading to a brief consolidation characterized by low volatility. Yet, the price experienced a sudden rebound, marked by the appearance of a substantial green candle.
However, as the price climbed and reached the critical 61.8% Fibonacci level, a pivotal target in the correction stages of the market, buying pressure weakened, prompting a reversal. Consequently, Bitcoin embarked on another impulsive retracement, driving its price back towards the $25K range.
In the days ahead, the $25K threshold serves as a substantial psychological support level should sellers manage to push the price beneath this critical mark. The market could witness another swift descent toward lower price thresholds.
On-chain Analysis
By Shayan
This chart illustrates the 14-day moving average applied to the Miner to Exchange Flow metric alongside the fluctuations in Bitcoin’s market price. This unique metric is a barometer for the volume of coins from miners to exchanges, shedding light on potential selling pressures from miners.
Interestingly, over the past several months, price downturns, whether major or minor, have consistently overlapped with instances where miners initiated the transfer of their Bitcoin holdings to SPOT exchanges.
However, a notable development recently unfolded as the metric experienced a substantial surge accompanying Bitcoin’s price touching the $30K mark. Curiously, this surge in miner activity contributed to a significant price retracement, nudging Bitcoin’s valuation downward to the $25K threshold. Subsequently, the metric saw a marked dip, hitting a yearly low.
Still, this metric shows signs of a slight rebound, hinting at the potential for renewed miner activity in the upcoming days. As such, it would be prudent for traders to keep a watchful eye on miners’ behaviors, remaining alert for any signs of heightened or diminished selling activities, as these actions could significantly influence Bitcoin’s short-term trajectory.
The post BTC’s In Danger, This is The Most Critical Level Now (Bitcoin Price Analysis) appeared first on CryptoPotato.