


Ripple’s price action has been far from convincing lately, as the cryptocurrency has been rejected from a key resistance level against the USD. XRP is also in a downtrend on the BTC paired chart, making things worse.
Technical Analysis
By: Edris
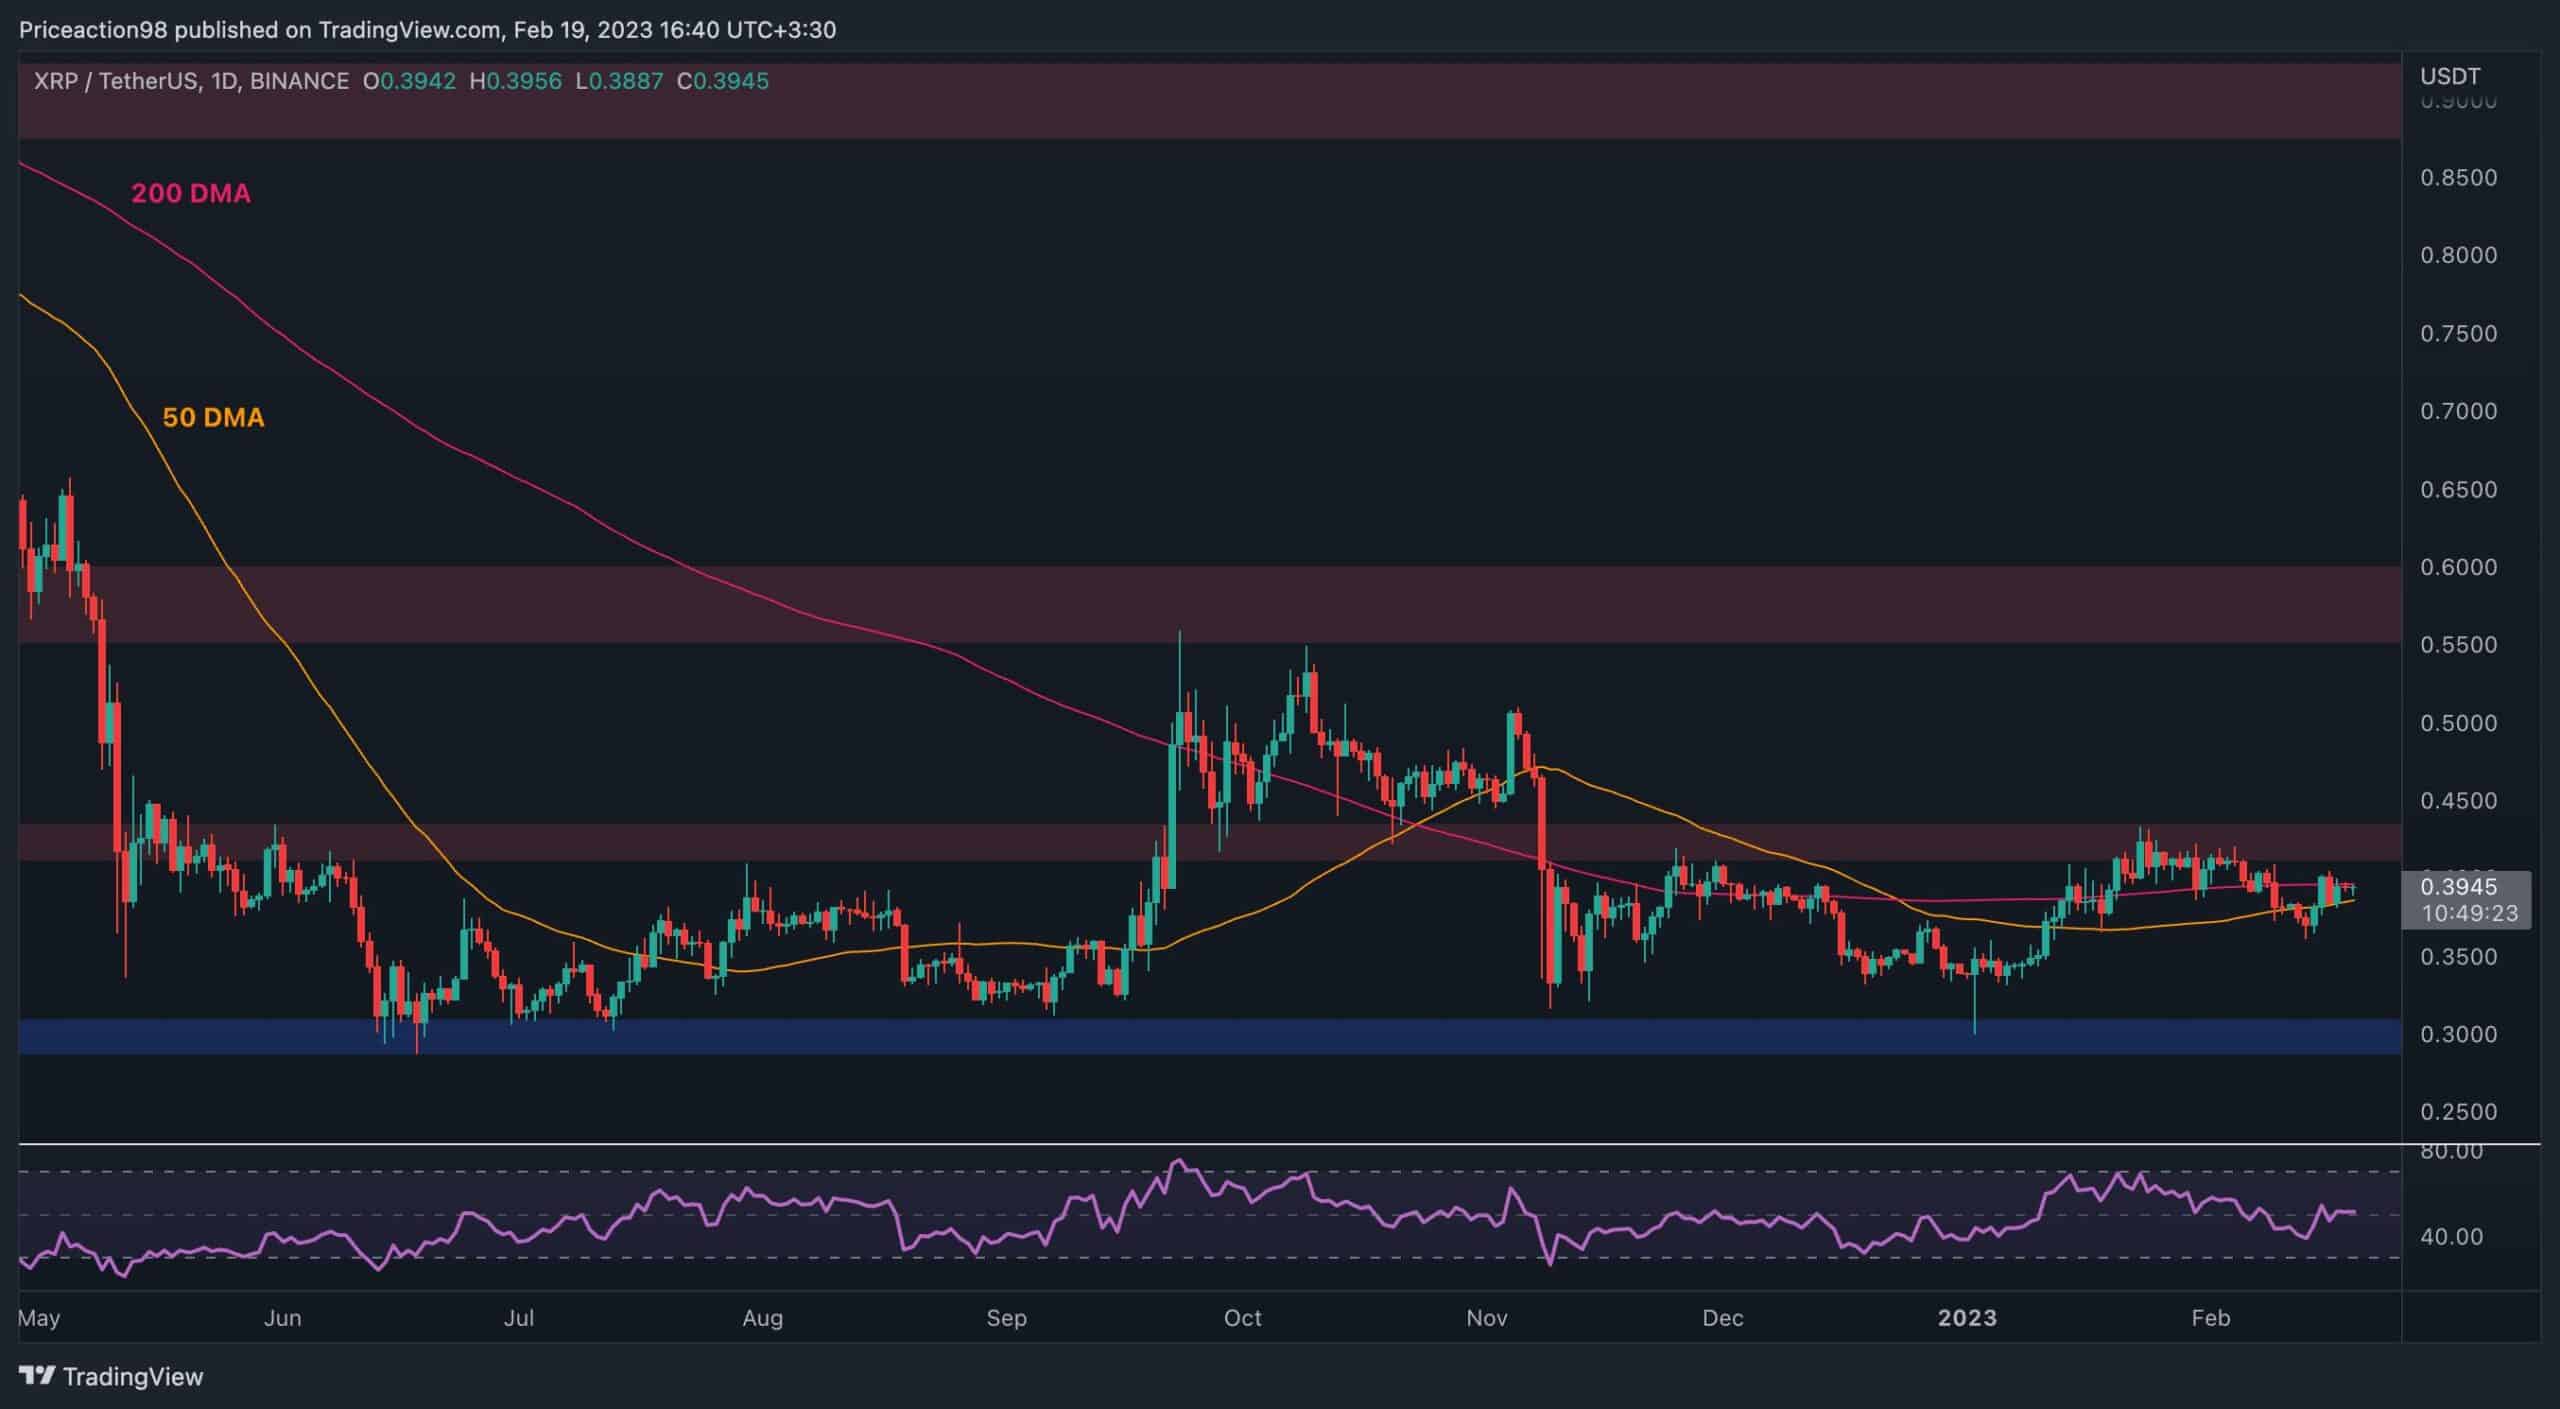
XRP/USDT Daily Chart:
On the XRPUSDT chart’s daily timeframe, the price has been rejected from the $0.43 level multiple times and is currently oscillating between the 200-day and 50-day moving averages located around $0.395 and $0.385 levels, respectively.
In case the 50-day moving average is broken to the downside, a drop toward the key $0.3 support level would be more likely in the short term. On the other hand, if the price manages to break above the $0.43 area, a rise toward the $0.55 resistance level would be likely.
Source: TradingView
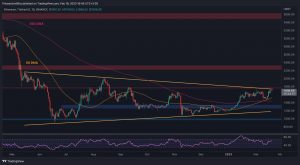
XRP/BTC Daily Chart:
Against Bitcoin, XRP has been on a free fall since breaking the 0.000018 SAT level to the downside and retesting it, failing to break back above. Currently, the 0.000015 SAT support level seems like the most likely destination in the short term.
The RSI indicator, however, is demonstrating an oversold signal, as the oscillator has broken below the 30 level. This signal could point to a potential bullish pullback or consolidation in the short-term before a further continuation lower.
Source: TradingView
The post XRP Struggles Around $0.4 But is a Crash Coming? (Ripple Price Analysis) appeared first on CryptoPotato.